
[Deep Learning] Similarity evaluation indicators commonly used in image dehazing and denoising: PSNR (Peak Signal-to-Noise Ratio) SSIM (Structural Similarity) MSE (Mean Square Error)
posted on 2023-06-06 17:30 read(769) comment(0) like(22) collect(2)
1. PSNR (Peak Signal-to-Noise Ratio)
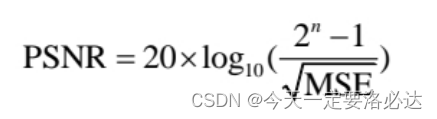
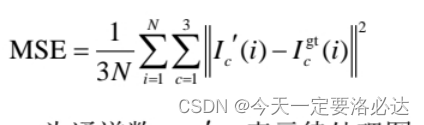
The formula is directly copied from my teacher's paper, n usually takes 8, which means 0-255. The larger the value, the closer to the real image.
It needs to be unpacked before use:
from skimage.metrics import peak_signal_noise_ratio
Let's try an example with three pictures:
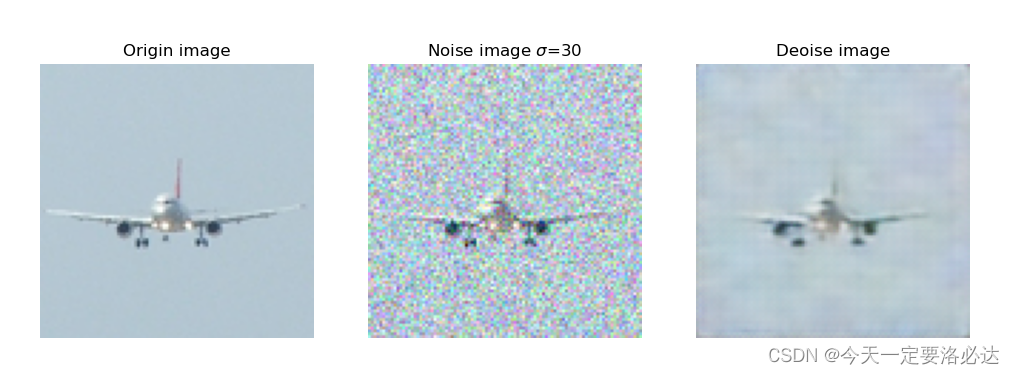
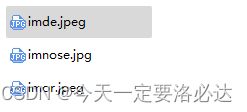
These three pictures are under the path:
Calculate the PSNR of the first and second pictures, and the PSNR of the first and third pictures respectively
from skimage.metrics import peak_signal_noise_ratio as PSNR
import matplotlib.pyplot as plt
imor=plt.imread('imor.jpeg')
imnose=plt.imread('imnose.jpg')
imde=plt.imread('imde.jpeg')
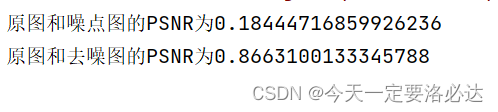
print('原图和噪点图的PSNR为{}'.format(PSNR(imor,imnose)))
print('原图和去噪图的PSNR为{}'.format(PSNR(imor,imde)))
It can be seen from here that the PSNR of the denoising image is higher, indicating that the denoising effect is good.
2. SSIM (Structural Similarity)
SSIM formula:
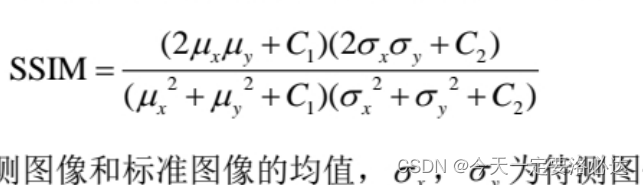
SSIM ranges between 0-1.
SSIM and PSNR are not the same, and it is not so simple to use a few more parameters.
Let’s first look at the function structure: I
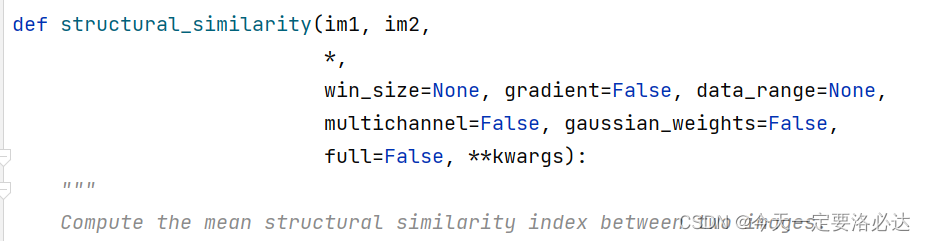
will not talk about im1 and im2. The latter pile is quite complicated (if the latter parameters are ignored, Only putting in the first two parameters will report an error.)
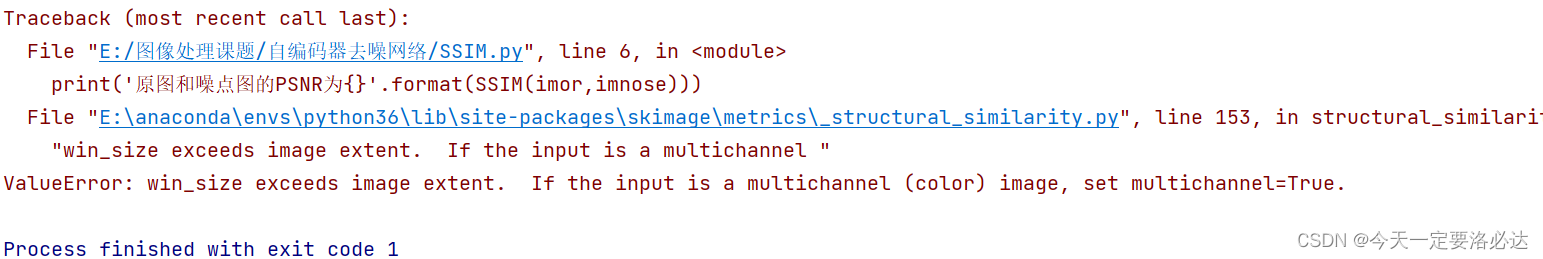
Anyway, add a multichannel=True
from skimage.metrics import structural_similarity as SSIM
import matplotlib.pyplot as plt
imor=plt.imread('imor.jpeg')
imnose=plt.imread('imnose.jpg')
imde=plt.imread('imde.jpeg')
print('原图和噪点图的PSNR为{}'.format(SSIM(imor,imnose,multichannel=True)))
print('原图和去噪图的PSNR为{}'.format(SSIM(imor,imde,multichannel=True)))
The PSNR of the denoising image here is significantly higher than that of the noise image, indicating that the denoising effect is good.
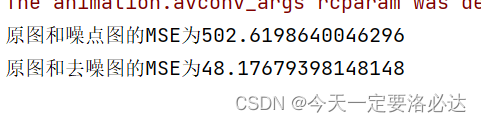
3. MSE (mean square error)
from skimage.metrics import mean_squared_error as MSE
import matplotlib.pyplot as plt
imor=plt.imread('imor.jpeg')
imnose=plt.imread('imnose.jpg')
imde=plt.imread('imde.jpeg')
print('原图和噪点图的MSE为{}'.format(MSE(imor,imnose)))
print('原图和去噪图的MSE为{}'.format(MSE(imor,imde)))
Vignette: plt.savefig() saves a blank image
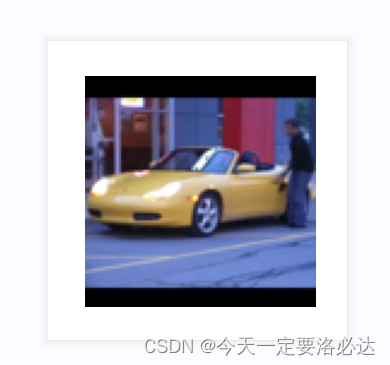
When doing this experiment today, I need a set of comparison pictures, so I went to the STL10 dataset to download and save some photos, and I plan to save some photos with savefig:
import torch
import numpy as np
from torchvision.datasets import STL10
import matplotlib.pyplot as plt
from skimage.util import random_noise #添加噪声模块
import torch.utils.data as Data
from sklearn.model_selection import  train_test_split
import hiddenlayer as hl
import torch.nn as nn
from tqdm import tqdm
from skimage.measure import compare_psnr
import os
os.environ["KMP_DUPLICATE_LIB_OK"]="TRUE"

data=STL10('data',download=False)
def read_image(path):
    with open(path,'rb') as f:
        data1=np.fromfile(f,dtype=np.uint8)
        images=np.reshape(data1,(-1,3,96,96))
        images=np.transpose(images,(0,3,2,1))
    return images/255.0
data_path='E:/图像处理课题/自编码器去噪网络/data/stl10_binary/train_X.bin'
images=read_image(data_path)  #最后输出的5000张图片
print(type(images)) #格式为<class 'numpy.ndarray'>
print("images.shape:",images.shape)
print("images.shape:",images.shape[0])
#print(images)
plt.figure(figsize=(3,3))
for i in range(1):
    plt.subplot(1,1,1)
    plt.imshow(images[i+1000])
    plt.axis('off')
plt.show()
plt.savefig('1.jpg')

At the beginning, my code was written like this, and it turned out that the saved picture was blank:

the reason for this error here is that plt.show() and plt.savefig() cannot be used together.
If you want to run normally, you need to comment out plt.show(), and then it will be normal:
but if you want to save ndarray as an image, it is generally appropriate to use plt.imsave:
plt.imsave('imor.jpeg', imor)
Category of website: technical article > Blog
Author:kimi
link:http://www.pythonblackhole.com/blog/article/83103/b75c2996a14331ac2a6a/
source:python black hole net
Please indicate the source for any form of reprinting. If any infringement is discovered, it will be held legally responsible.
name:
Comment content: (supports up to 255 characters)