
Python 数据可视化详解
posted on 2023-05-07 21:33 read(1291) comment(0) like(6) collect(4)
Data visualization is a data presentation technology that converts complex and abstract data into intuitive and easy-to-understand graphics. It can help us quickly grasp the distribution and laws of data, and understand and explore information more easily. In today's era of information explosion, data visualization is getting more and more attention.
1. Matplotlib
Matplotlib is the most commonly used and most famous data visualization module in Python. The submodule pyplot of this module contains a large number of functions for drawing various charts.
1. Draw basic charts
The most basic charts in daily work include column charts, bar charts, line charts, pie charts, etc. The Matplotlib module provides corresponding drawing functions for these charts. The data used to draw the chart can directly use the provided code, or can be imported from an Excel workbook through the read_excel() function of the pandas module.
1. Draw a histogram
Code file: draw column chart.py
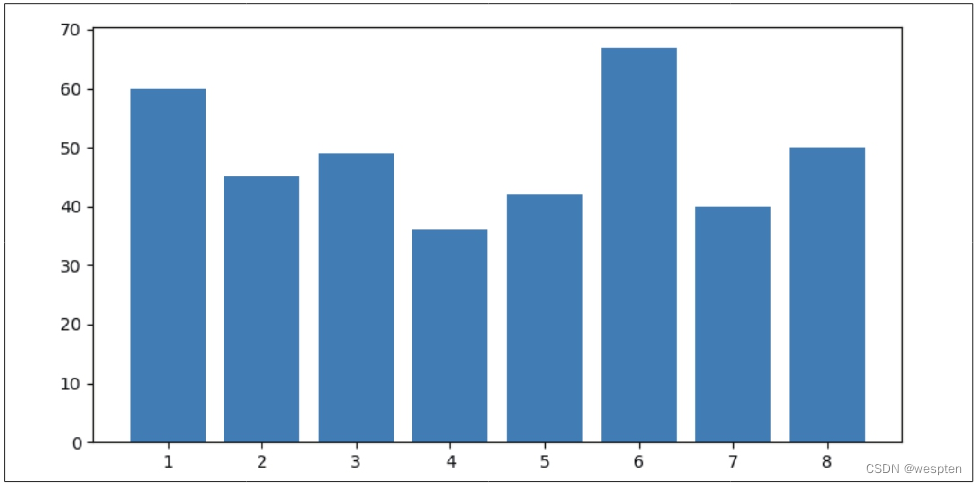
Column charts are usually used to visually compare data and are frequently used in practical work. A column chart can be drawn using the bar() function in the Matplotlib module.
The demo code is as follows:
- 1 import matplotlib.pyplot as plt
- 2 x = [1, 2, 3, 4, 5, 6, 7, 8]
- 3 y = [60, 45, 49, 36, 42, 67, 40, 50]
- 4 plt.bar(x, y)
- 5 plt.show()
The first line of code imports the submodule pyplot of the Matplotlib module. The second and third lines of code give the values of the x-axis and y-axis of the chart respectively. The fourth line of code uses the bar() function to draw a column chart, and the fifth line The code uses the show() function to display the plotted chart.
The result of running the code is shown in the figure below:
Category of website: technical article > Blog
Author:mmm
link:http://www.pythonblackhole.com/blog/article/370/13b5e5652c09d1b66686/
source:python black hole net
Please indicate the source for any form of reprinting. If any infringement is discovered, it will be held legally responsible.
name:
Comment content: (supports up to 255 characters)
no articles