
Python - draw a circle
posted on 2023-06-06 10:10 read(242) comment(0) like(4) collect(5)
Method one generates a circle:
Method 2 generates circles:
Here we are using [matplotlib] generated, but I use the Chinese title, so I need to add two sentences separately:
- plt.rcParams['font.sans-serif'] = ['SimHei'] # 用来正常显示中文标签
- plt.rcParams['axes.unicode_minus'] = False # 用来正常显示负号
With these two sentences, we can display it on the panel normally when we display it.
We use axis('equal') to make the axial x-axis and y-axis equal, so as to draw a better circle.
axis('equal')
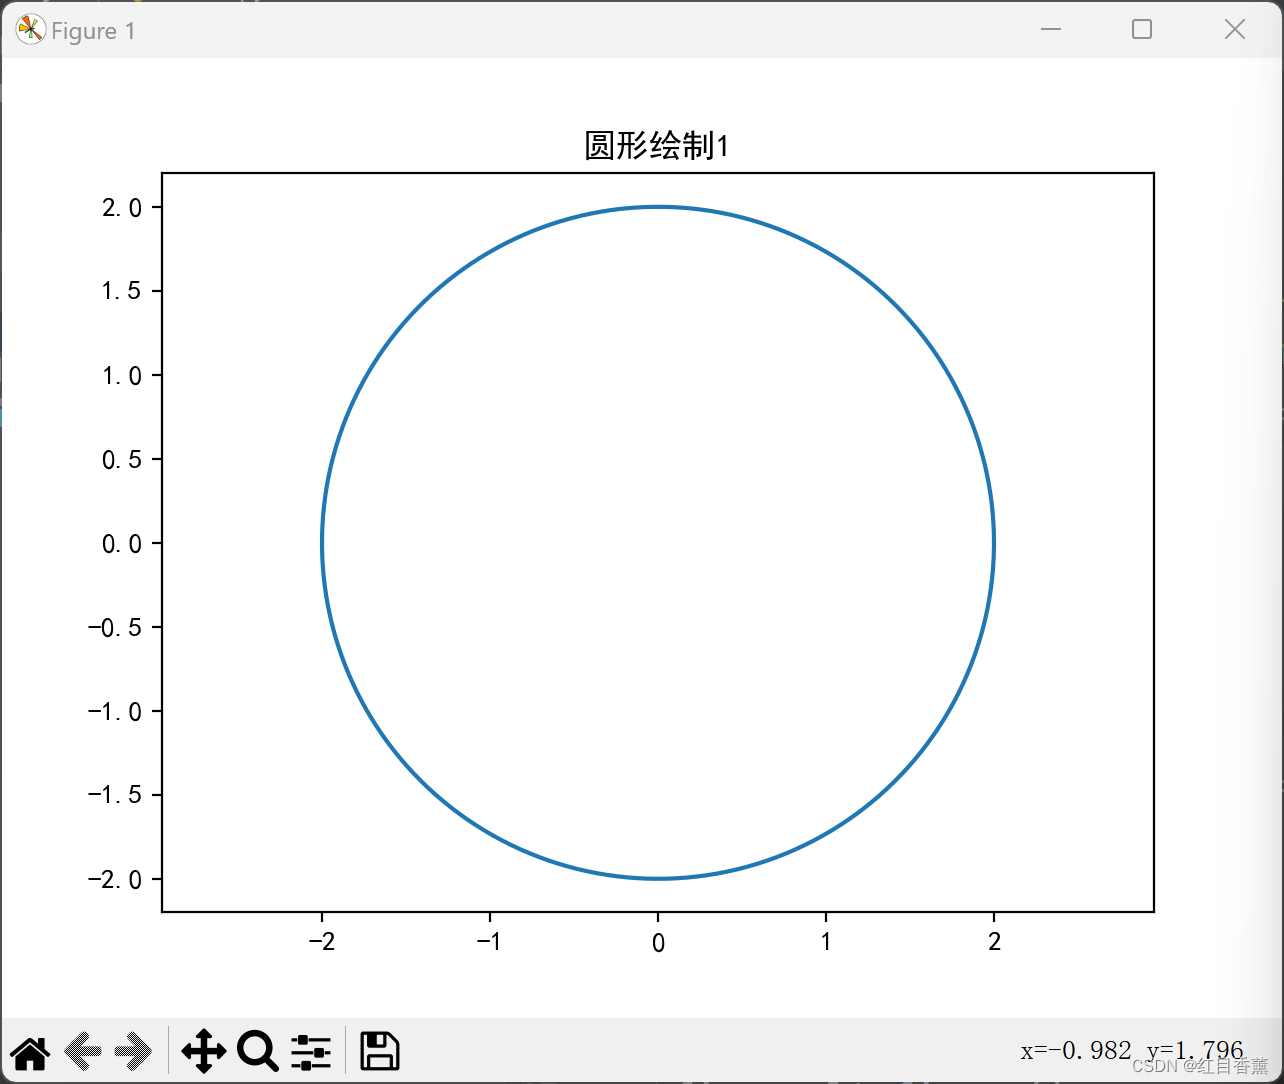
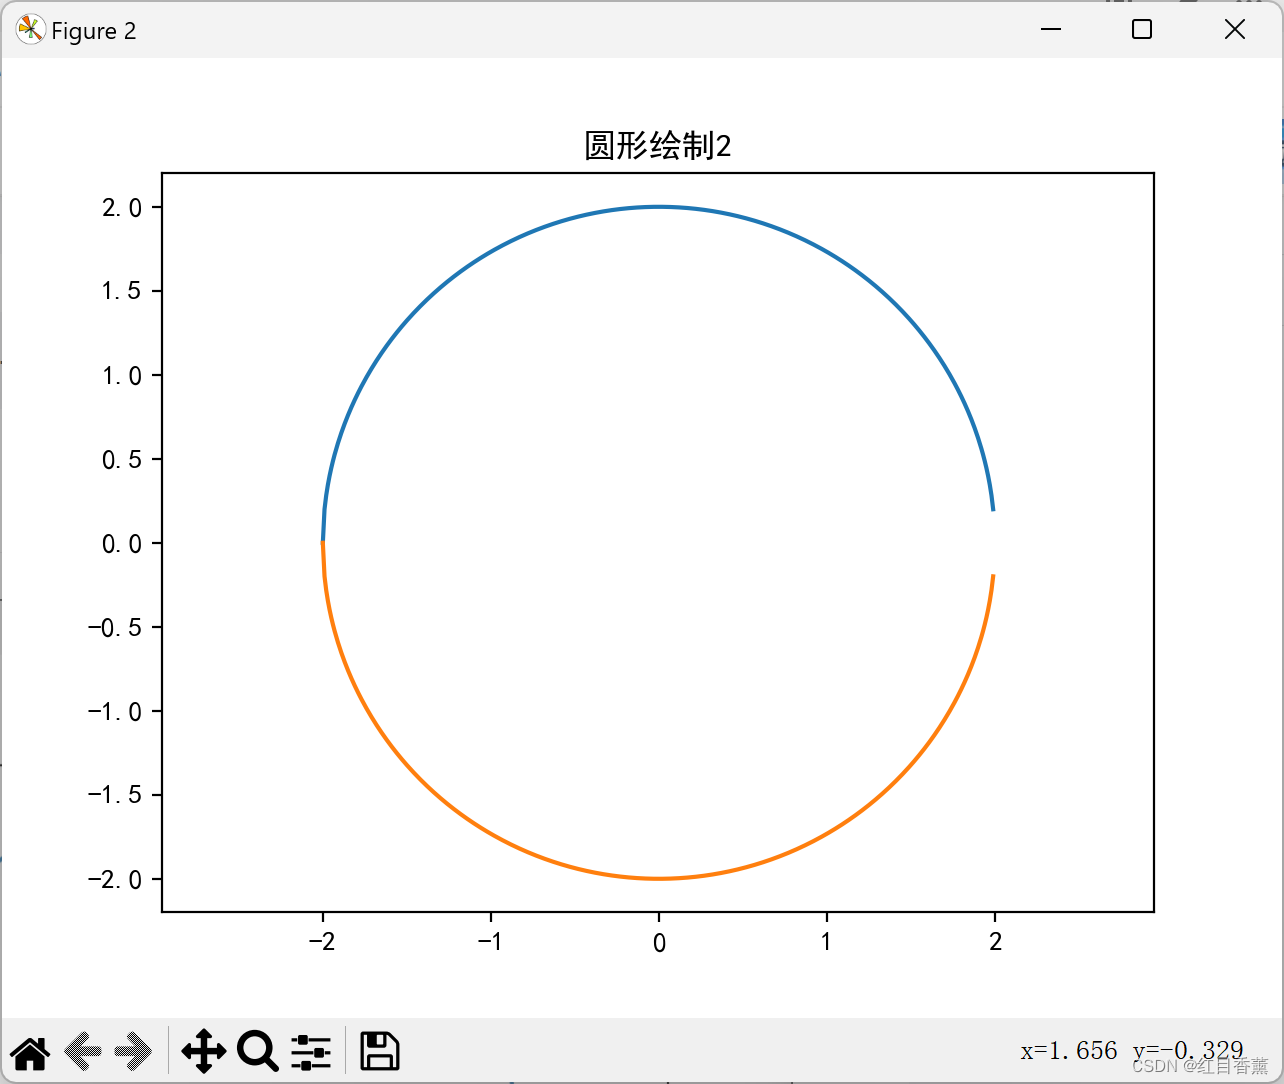
The following is how we draw a circle with r=2 as the radius and a,b=(0.,0.) as the center coordinates. I have used two methods for calculation here, which are relatively easy, but One is drawn using con and sin, and the second is drawn using sqrt square root . In the process, we should pay attention that all variables are floating point numbers. If only integer calculations are performed in unit coordinates It is difficult to draw a better-looking circle.
- import numpy as np
- import matplotlib.pyplot as plt
-
- plt.rcParams['font.sans-serif'] = ['SimHei'] # 用来正常显示中文标签
- plt.rcParams['axes.unicode_minus'] = False # 用来正常显示负号
- # ==========================================
- # 圆的基本信息
- # 1.圆半径
- r = 2.0
- # 2.圆心坐标
- a, b = (0., 0.)
- # ==========================================
- # 方法一:参数方程
- theta = np.arange(0, 2 * np.pi, 0.01)
- x = a + r * np.cos(theta)
- y = b + r * np.sin(theta)
- fig = plt.figure()
- axes = fig.add_subplot(111)
- axes.plot(x, y)
- axes.axis('equal')
- plt.title('圆形绘制1')
- # ==========================================
- # 方法二:标准方程
- x = np.arange(a - r, a + r, 0.01)
- y = b + np.sqrt(r ** 2 - (x - a) ** 2)
- fig = plt.figure()
- axes = fig.add_subplot(111)
- axes.plot(x, y) # 上半部
- axes.plot(x, -y) # 下半部
- plt.axis('equal')
- plt.title('圆形绘制2')
- # ==========================================
- plt.show()

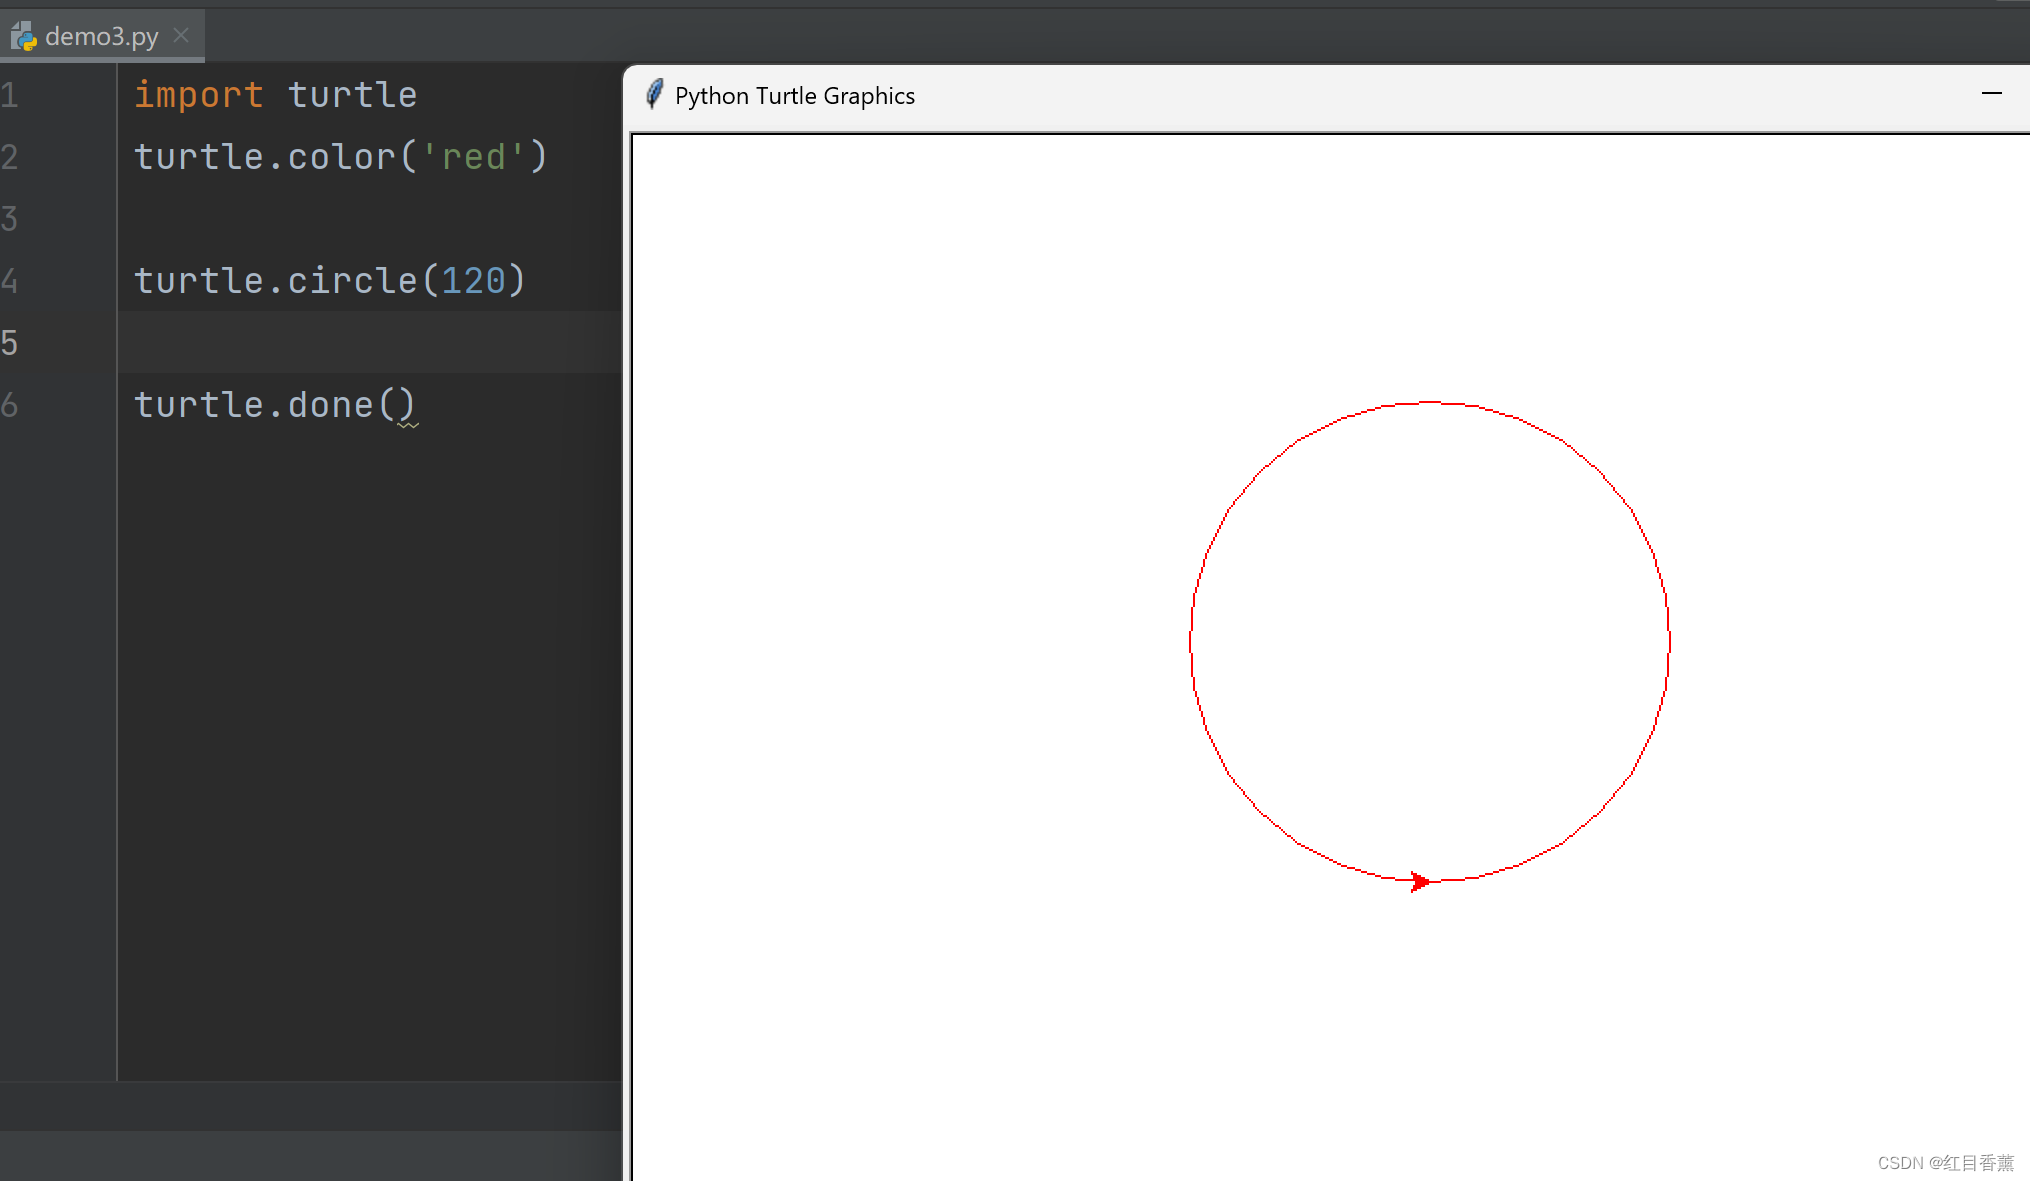
In fact, the simplest circle has to look at the following: here we use turtle , directly use the function color it brings to set the color, circle is to set the radius of the circle, and finally display it. Very happy.
- import turtle
-
- turtle.color('red')
-
- turtle.circle(120)
-
- turtle.done()
This circle is equivalent to the process of hand-painting. The effect is still very good.
Turtle module for Python drawing:
In the "National Youth Software Programming Level Examination" organized by the Chinese Institute of Electronics, candidates are required to know the functions of the turtle library , know how to import the library file, and master its use methods: forward, backward, left and right, lifting the pen, Draw dots, circles, etc.
turtle, Chinese is sea turtle, so we sometimes call it sea turtle drawing.
Turtle module drawing ideas
- First import the turtle module;
- The initial default position is set at (0,0), which is the center of the window (the initial position can be set), and the drawing direction is from left to right;
- The turtle module simulates drawing graphics with a pen. The default pen is downward (turtle.pendown()), as if the pen tip is placed on paper;
- When starting to draw, set the pen down and move the drawing as required.
- After drawing, raise the pen turtle.penup()
Category of website: technical article > Blog
Author:Soledad
link:http://www.pythonblackhole.com/blog/article/79674/907aa237db13a571880e/
source:python black hole net
Please indicate the source for any form of reprinting. If any infringement is discovered, it will be held legally responsible.
name:
Comment content: (supports up to 255 characters)