
mpl_toolkits, one of the Python matplot toolkits, draws your world map
posted on 2023-06-06 10:02 read(309) comment(0) like(30) collect(3)
mpl_toolkits, one of the Python matplot toolkits, draws your world map
The reason why Python is so popular is that it can not only be used in the field of science and technology, but also be used as a research tool in many other disciplines. Drawing maps is one of its functions.
Today we use mpl_toolkits, one of the matplot toolkits, to draw a world map . This is a simple visualization tool. If you want to draw more complex maps, you can consider using Google Maps API, but this is out of the scope of our discussion today.
1. Prepare
Before starting, you need to make sure that Python and pip are successfully installed on your computer.
**(Optional 1) **If you use Python for data analysis, you can install Anaconda directly, which has built-in Python and pip.
**(Optional 2) **In addition, it is recommended that you use the VSCode editor, which has many advantages.
Please choose one of the following ways to enter the command to install dependencies :
- Windows environment open Cmd (Start-Run-CMD).
- Open Terminal in the MacOS environment (command+space to enter Terminal).
- If you are using VSCode editor or Pycharm, you can directly use the Terminal at the bottom of the interface.
pip install numpy
pip install matplotlib
In order to use mpl_toolkits, simply installing matplotlib is not enough, we also need to install basemap separately, if you have already installed Anaconda, then this step is very easy to do, enter the following command to install:
conda install basemap

If not, it's a little more troublesome:
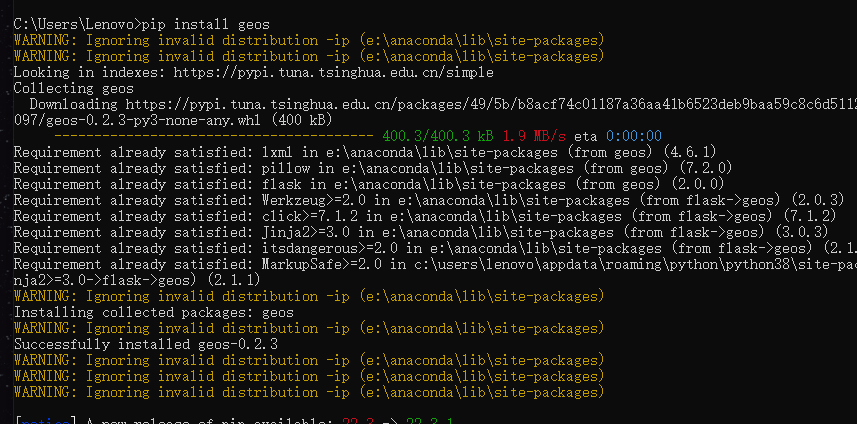
1. Install geos: pip install geos
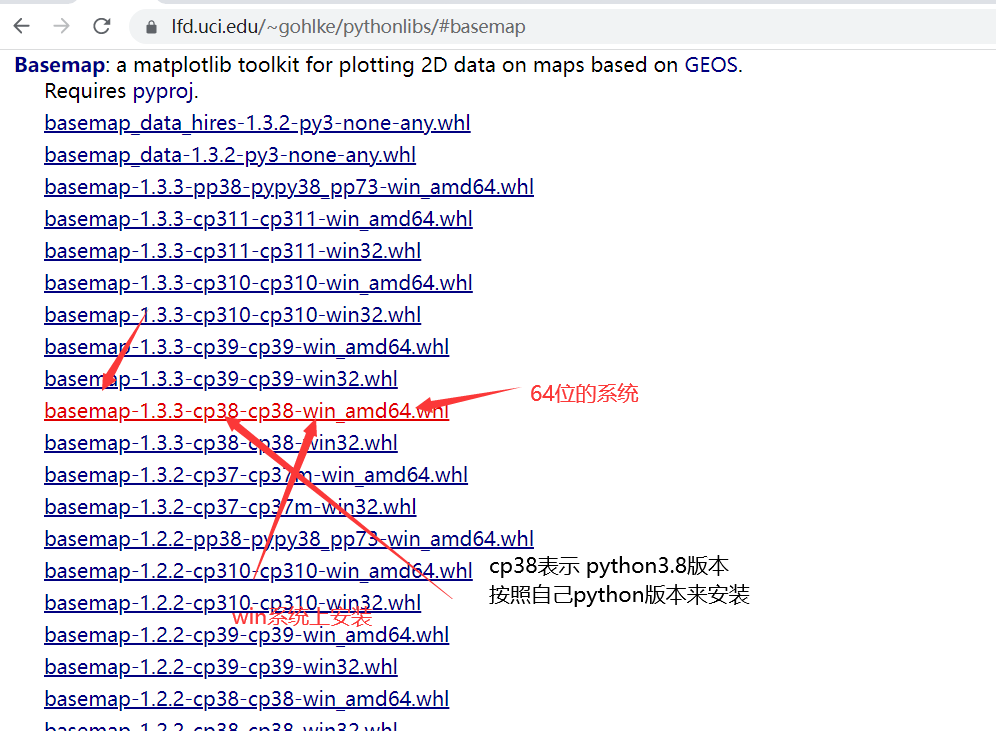
2. Download basemap according to your Python version
http://www.lfd.uci.edu/~gohlke/pythonlibs/#basemap
Note that the number after cp is the version of Python. (press ctrl+F on the page, enter basemap for quick positioning)
3. Enter the directory of the file under cmd and run
pip install basemap‑1.2.1‑cp37‑cp37m‑win_amd64.whl
2. Simple map
Let's start by drawing a globe with the center pointing towards China:
#绘制一个地球
import numpy as np
import matplotlib.pyplot as plt
from mpl_toolkits.basemap import  Basemap

#初始化图形
plt.figure(figsize=(8,8))
#底图:圆形 ,lat_0:纬度:log_o:经度,(113,29)是武汉
m=Basemap(projection='ortho',resolution=None,lat_0=29,lon_0=113)

#底色
m.bluemarble(scale=0.5)
#显示
plt.show()
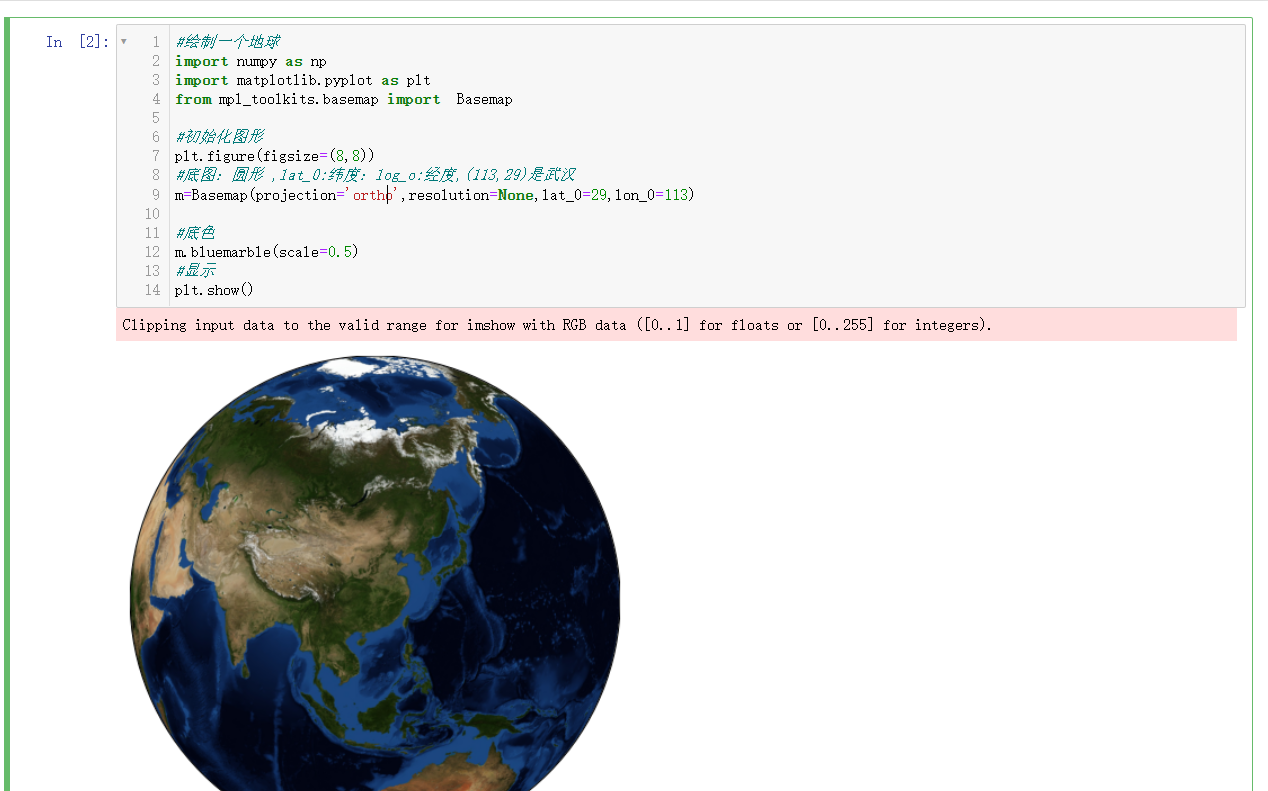
The effect is not bad, not only that, it is not just an image, it is a fully functional matplot canvas. This also means, you can draw lines on it! Let's zoom in on the map, enter the China region, and mark the location of Shenzhen:
不要用蓝底图了,看得不是很清晰,我们换成浮雕型:#导入需要的包
import numpy as np
import matplotlib.pyplot as plt
from mpl_toolkits.basemap import  Basemap

#以下三行是为了让matplot能显示中文
from  pylab import  mpl
mpl.rcParams['font.sans-serif']=['FangSong']
mpl.rcParams['axes.unicode_minus']=False

fig=plt.figure(figsize=(8,8))

#注意几个新增的参数,width和height是用来控制放大尺度的
#分别代表投影的宽带和高度(8E6 代表,8x10^6米
m=Basemap(projection='lcc',resolution=None,width=8E6,height=8E6,lat_0=23,lon_0=113,)
m.etopo(scale=0.5)

#这里的经纬度:(经度,纬度)
x,y=m(113,23)
plt.plot(x,y,'ok',markersize=5)
plt.text(x,y,'深圳',fontsize=12,color="red")
plt.show()

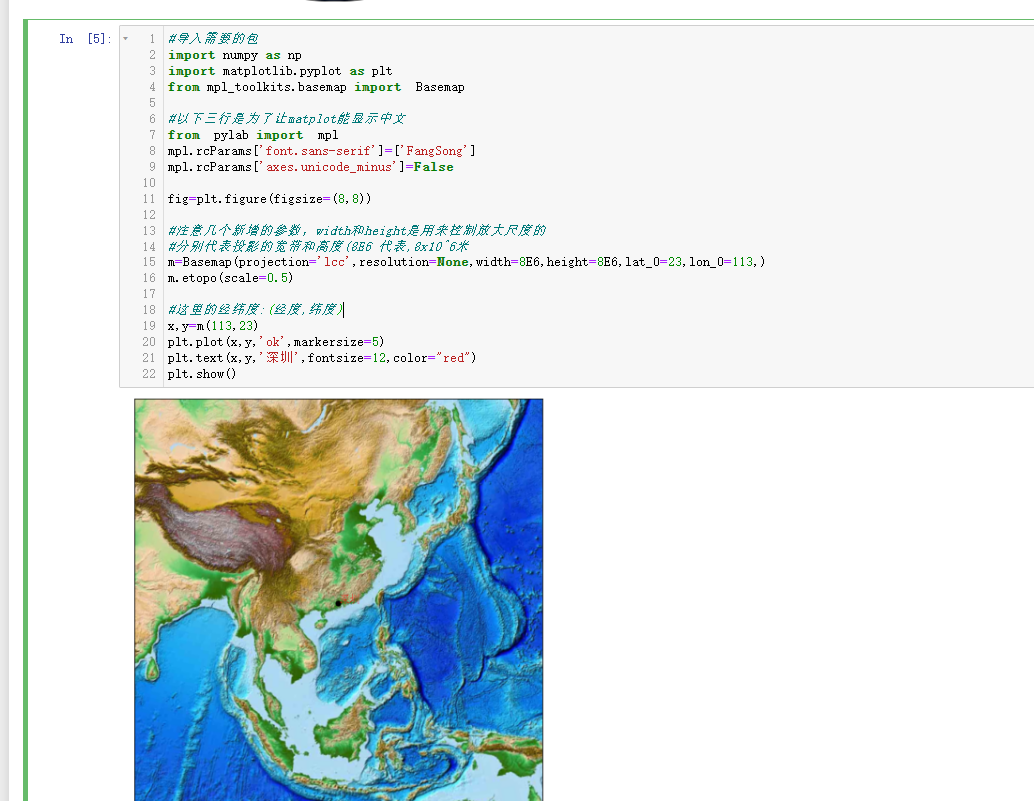
Geographic features such as mountains and hills can be clearly seen. You can also connect certain cities or draw areas between certain longitudes and latitudes according to your needs. Don't forget, this is matplotlib's editable canvas.
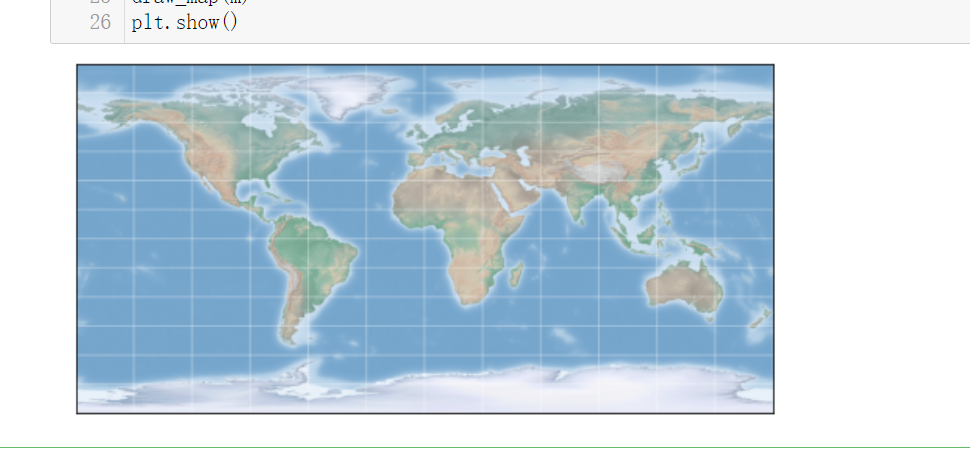
3. World map
Next, we unfold the above-mentioned world map into a plane graphic with latitude and longitude lines.
#导入需要的包
import numpy as np
import matplotlib.pyplot as plt
from mpl_toolkits.basemap import  Basemap
from itertools import  chain

def draw_map(m,scale=0.2):
    #绘制带阴影的浮雕图像
    m.shadedrelief(scale=scale)
    #根据经纬度切割,每13度一条线
    lats=m.drawparallels(np.linspace(-90,90,13))
    lons=m.drawmeridians(np.linspace(-180,180,13))

    #集合所有线条
    lat_lines=chain(*(tup[1][0] for tup in lats.items()))
    lon_lines = chain(*(tup[1][0] for tup in lons.items()))
    all_lines = chain(lat_lines,lon_lines)
    #循环画线
    for line in all_lines:
        line.set(linestyle='-',alpha=0.3,color='w')
fig=plt.figure(figsize=(8,6),edgecolor='w')
m=Basemap(projection='cyl',resolution=None,
          llcrnrlat=-90,urcrnrlat=90,
          llcrnrlon=-180,urcrnrlon=180,)
draw_map(m)
plt.show()

Set the points of interest on the map:
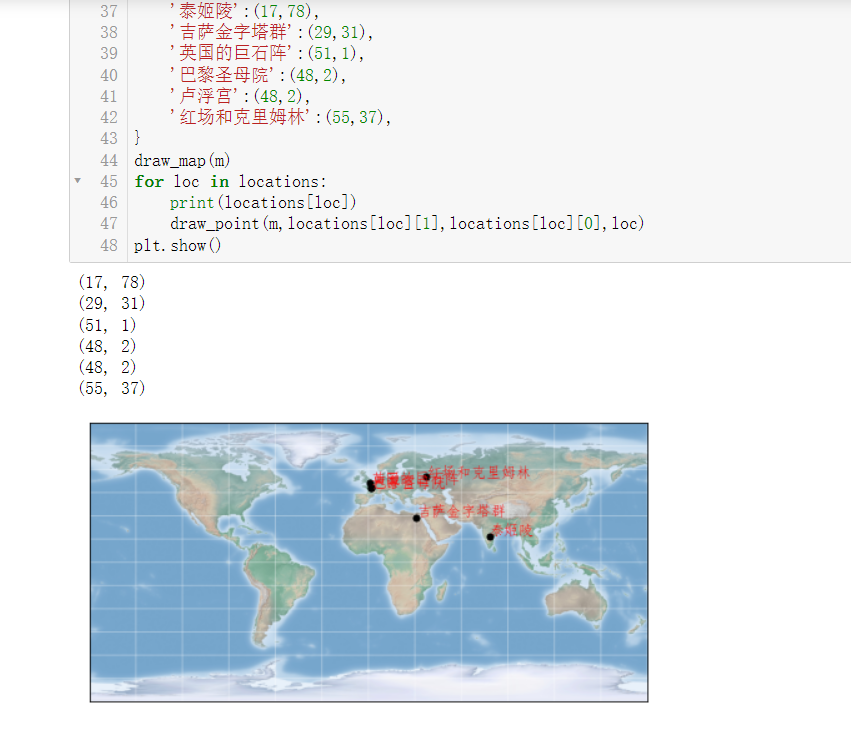
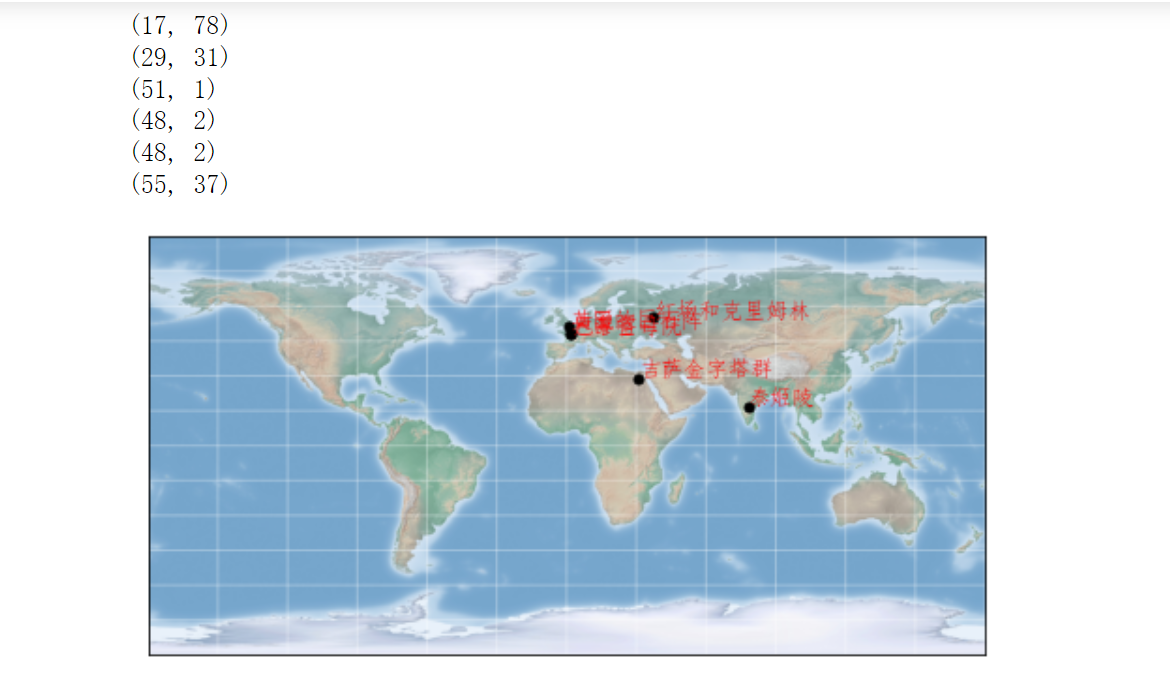
In this way, you only need to add the latitude and longitude of a certain place to the locations similarly, and it can be displayed on the map. You can also draw a custom line between two places, or focus on zooming in on a certain area. All in all, basically what you want to do can be done based on Matplotlib.
Category of website: technical article > Blog
Author:Theheartoflove
link:http://www.pythonblackhole.com/blog/article/79658/fc013b424b1367d4d447/
source:python black hole net
Please indicate the source for any form of reprinting. If any infringement is discovered, it will be held legally responsible.
name:
Comment content: (supports up to 255 characters)
no articles