
Crop leaf disease detection system based on deep learning (UI interface + YOLOv5 + training data set)
posted on 2023-06-06 09:46 read(728) comment(0) like(8) collect(1)

Abstract: The crop leaf disease detection system is used to intelligently detect common crop leaf diseases, automatically mark, record and save the location and type of diseases, and assist crop disease control to increase output value. This paper introduces in detail the crop leaf disease detection system based on the YOLOv5 deep learning model . While introducing the algorithm principle, it also gives the implementation code of Python, the UI interface of PyQt and the training data set . In the interface, various pictures and videos can be selected for detection and identification; multiple targets in the images can be identified and classified, and various types of crop leaf diseases can be identified. The blog post provides a complete Python code and usage tutorial, which is suitable for beginners to refer to. For the complete code resource file, please go to the download link at the end of the article. The catalog of this blog post is as follows:
Demonstration and introduction of crop leaf disease detection system (UI interface + YOLOv5 + training data set)
foreword
Crop diseases mainly occur on plant leaves, and the type of plant infection can be judged by the characteristics of leaf disease. Early detection of plant diseases can greatly reduce yield loss and economic loss. However, manual detection takes a lot of time and labor costs, and the detection results are affected by human subjective consciousness and rely on professional knowledge. Secondly, there is a shortage of talents specializing in disease identification, and it is difficult to meet market demand. Therefore, an efficient and fast artificial intelligence detection method is needed to solve this problem.
The plant disease detection algorithm based on YOLOv5 is used here, and the collected crop leaf disease data set is used for training, and the validity of the model is verified for the prediction output of the UI system. The crop leaf disease detection system is mainly used for the intelligent detection of common crop leaf diseases. Using the crop images collected by the camera, based on deep learning technology, it can identify 30 common disease types including apple scab, embroidered leaves, and corn gray leaf spot. Output the marked frame and corresponding category of the disease to assist automatic crop disease prevention and control; the software provides a login and registration function for user management; the software can effectively identify the image, video and other file forms collected by the camera, detect the disease on the leaf surface, and record The recognition results are easy to view in the interface table; the camera can be turned on to monitor and count the actual crop leaves in real time to detect their diseases, and the system supports result recording, display and storage.
Before development, I found some related scripts on the Internet. It seems that most of them focus on the configuration modification of algorithms such as YOLOv5-YOLOv8 (training with another data set). It is a good practice tutorial, but almost no one has developed it into a complete software that can be displayed. , it is not convenient to select files and detect in real time. For this, here is the interface designed by the blogger. PyQt5 is used to design and beautify the UI. The function can also meet the recognition and detection of pictures, videos and cameras. I hope you can like it. The initial interface is as follows:

The screenshot of the interface when detecting categories (click on the picture to enlarge) is as shown below, which can identify multiple categories in the screen, and can also enable camera or video detection:

For the detailed function demonstration effect, please refer to the blogger’s B station video or the animation demonstration in the next section. Friends who think it is good, please like, follow and bookmark! The design workload of the system UI interface is relatively large, and the interface beautification needs to be carefully crafted. If you have any suggestions or opinions, you can comment and exchange them below.
1. Effect demonstration
Whether the software is easy to use, appearance and function are important indicators. First, let’s take a look at the effect of identifying leaf diseases through the animation. The main function of the system is to detect crop diseases in pictures, videos and camera images. The results are visualized on the interface and images, and the display selection function of multiple diseases is provided. The demonstration effect is as follows.
(1) User registration and login interface
A login interface is designed here, where you can register an account and password, and then log in. The interface still refers to the current popular UI design. The left side is a moving picture, and the right side enters the account number, password, verification code, etc.

(2) Select image recognition
The system allows selection of image files for identification. After clicking the image selection button icon to select an image, the identification results of all crops will be displayed, and the identification results of individual leaf diseases can be viewed through the drop-down box. The interface display of this function is shown in the figure below:

(3) Video recognition effect display
Many times we need to identify the disease in a video, here is a video selection function. Click the video button to select the video to be detected, and the system will automatically analyze the video frame by frame to identify crops, and record the results in the table in the lower right corner, as shown in the figure below:

(4) Camera detection effect display
In real scenes, we often use the device camera to obtain real-time images, and at the same time need to identify the crops in the images, so this article takes this function into consideration. As shown in the figure below, after clicking the camera button, the system enters the ready state, the system displays the real-time picture and starts to detect the crops in the picture, and the recognition results are displayed as shown in the figure below:

2. Detection of crop leaf diseases
(1) System introduction
There are many types of common fruits and vegetables in daily life, and there are more types of leaf diseases. How to accurately and automatically identify diseases to improve crop yield and reduce economic losses is an important issue at present. As the existing plant disease detection methods cannot accurately and quickly detect the problem of diseased areas in plant leaves, the blogger here uses a mature deep learning method based on YOLOv5 to detect common diseases such as potato and tomato leaves. The potato, corn, and tomato leaf disease data sets were constructed through data enhancement and image annotation technology, and the detection and identification of leaf diseases were realized by using the YOLOv5 backbone network's ability to extract disease characteristics. By consulting the data and training test code, the blogger feels that YOLOv5 is a high-performance solution for apple and tomato leaf disease detection, which can classify and locate plant leaf diseases with high accuracy. Of course, YOLOv6, YOLOv7, YOLOv8 and other algorithms are constantly being proposed and improved, and bloggers will design the algorithm of this system again after the code version matures, so stay tuned.
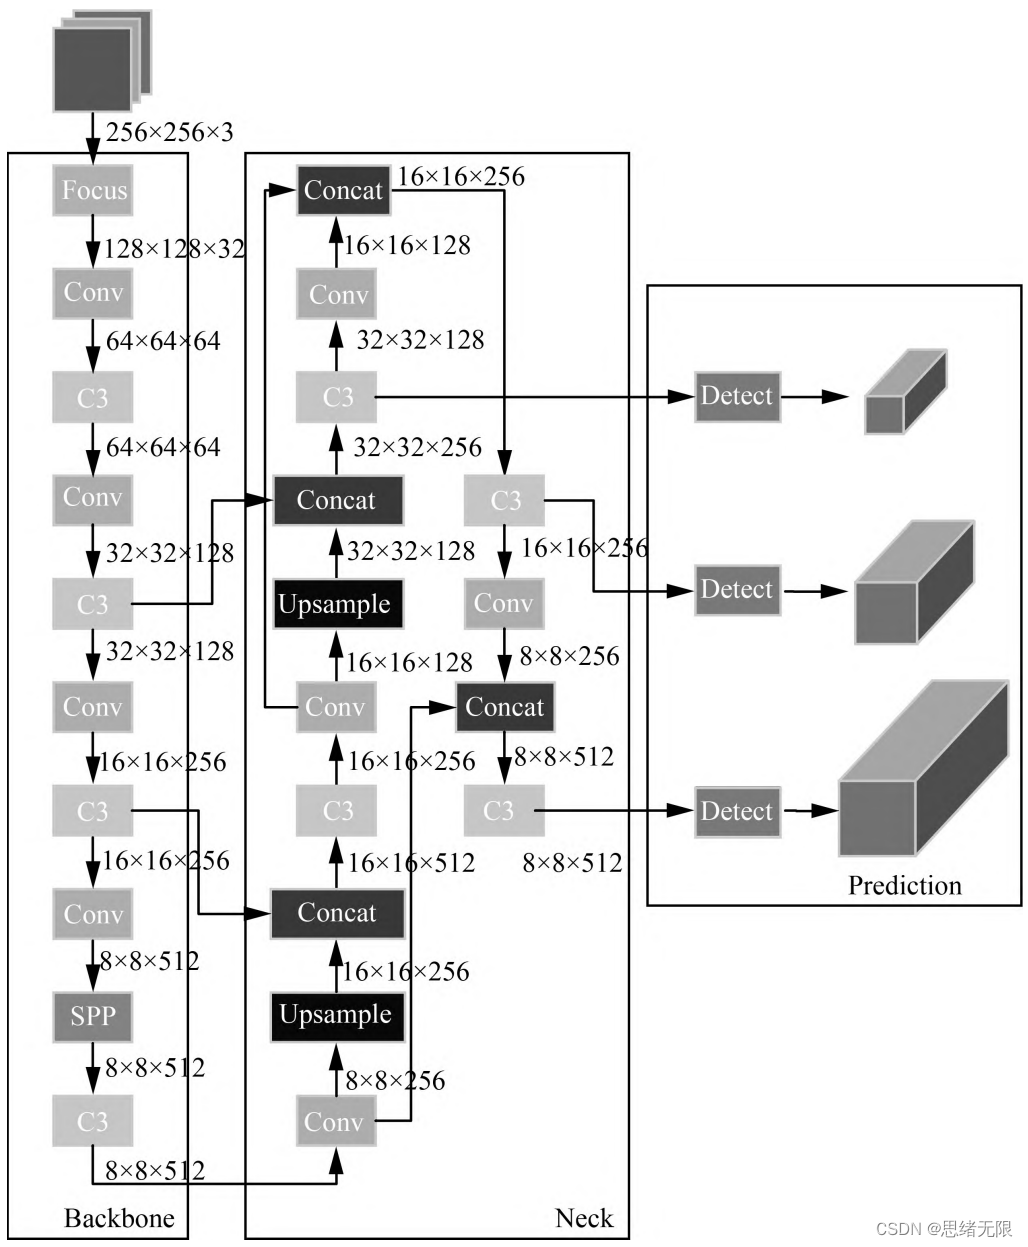
(2) Network structure
The Yolov5 network structure is composed of Input, Backbone, Neck, and Prediction. The input part of Yolov5 is the input end of the network, and the Mosaic data enhancement method is used to randomly crop the input data and then stitch them together. Backbone is the part of the network where Yolov5 extracts features, and the feature extraction capability directly affects the performance of the entire network. Yolov5's Backbone proposed a new Focus structure compared to the previous Yolov4. The Focus structure is to slice the picture, and transfer the W (width) and H (height) information to the channel space, so that a 2-fold downsampling operation is performed without losing any information.
(4) Data set and training
Here we use the crop leaf dataset. In addition to the category label, each picture also has a marked object frame (Bounding Box). The types of diseases involved are as follows:
Chinese_name = {'Apple Scab Leaf': "苹果黑星病叶", 'Apple leaf': "苹果叶", 'Apple rust leaf': "苹果绣叶",
                'Bell_pepper leaf spot': "甜椒叶斑病", 'Bell_pepper leaf': "甜椒叶",
                'Blueberry leaf': "蓝莓叶", 'Cherry leaf': "樱桃叶", 'Corn Gray leaf spot': "玉米灰叶斑病",
                'Corn leaf blight': "玉米叶枯病", 'Corn rust leaf': "玉米锈叶", 'Peach leaf': "桃叶",
                'Potato leaf early blight': "马铃薯叶早疫病", 'Potato leaf late blight': "马铃薯叶晚疫病",
                'Potato leaf': "马铃薯叶", 'Raspberry leaf': "覆盆子叶", 'Soyabean leaf': "大豆叶",
                'Soybean leaf': "大豆叶", 'Squash Powdery mildew leaf': "南瓜白粉病叶",
                'Strawberry leaf': "草莓叶", 'Tomato Early blight leaf': "番茄早疫病叶",
                'Tomato Septoria leaf spot': "番茄叶斑病", 'Tomato leaf bacterial spot': "番茄叶细菌性斑病",
                'Tomato leaf late blight': "番茄叶晚疫病", 'Tomato leaf mosaic virus': "番茄叶花叶病毒",
                'Tomato leaf yellow virus': "番茄叶黄病毒", 'Tomato leaf': "番茄叶",
                'Tomato mold leaf': "番茄霉叶", 'Tomato two spotted spider mites leaf': "番茄二斑叶螨叶",
                'grape leaf black rot': "葡萄叶黑腐病", 'grape leaf': "葡萄叶"}
In the crop leaf disease data set, the training set contains 2330 pictures, and the test set contains 239 pictures. Some data and labels are shown in the figure below.

Each image is marked with the LabelImg tool, which provides the bounding box of the crop leaves in the image, the key part information of the crop leaves, and the attribute information of the crop leaf diseases. Some pictures of the dataset are shown in the figure below.

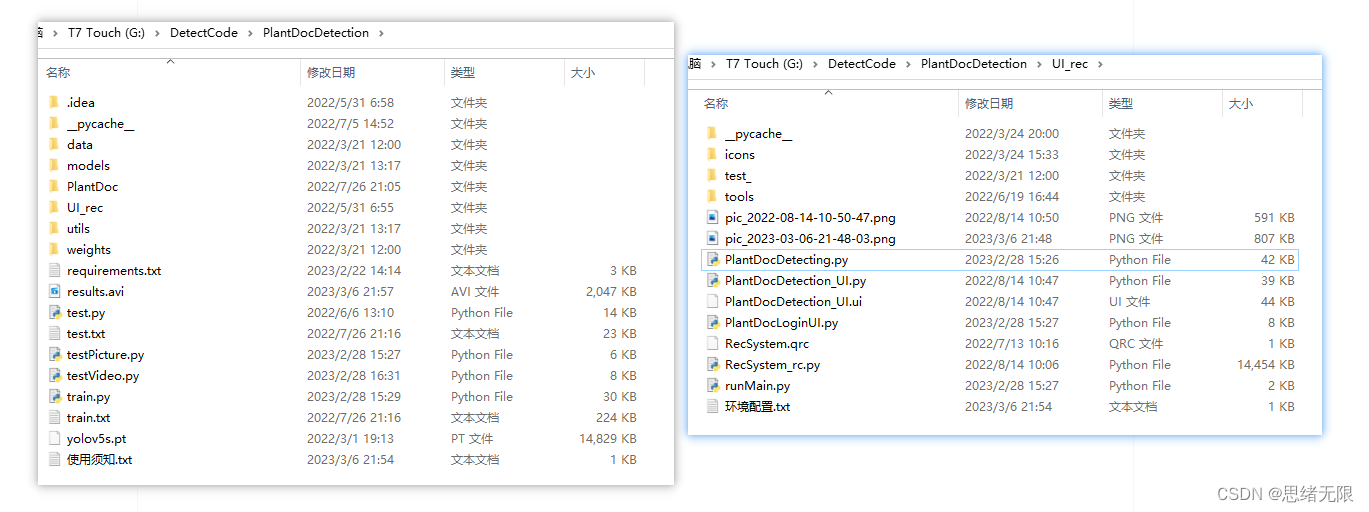
The content contained in the root directory of this project file is shown in the figure below, where train.py is used to train your own data set. We train and test our own datasets basically using these codes. Based on the preparation of the data set and configuration files, we run the train.py script for training.

In deep learning, we usually observe the model training situation through the curve of the loss function decline. The YOLOv5 training mainly includes three aspects of loss: rectangular box loss (box_loss), confidence loss (obj_loss) and classification loss (cls_loss). After the training is over, we can also find some training processes in the logs directory. summary graph. The figure below is a model training curve for bloggers training crop leaf recognition.

The following are the results of the terminal output during the training process. The entire training goes through 300 Epochs, and the best model is finally saved in the logs folder.

Generally, we will come into contact with two indicators, namely recall rate recall and precision precision. The two indicators p and r simply judge the quality of the model from one angle, and both are values between 0 and 1. Where closer to 1, the performance of the model is better, and closer to 0, the performance of the model is worse. In order to comprehensively evaluate the performance of target detection, the average average density map is generally used to further evaluate the quality of the model. By setting different confidence thresholds, we can get the p-value and r-value calculated by the model under different thresholds. In general, the p-value and r-value are negatively correlated. After drawing, we can get the following figure In the curve shown, the area of the curve is called AP, and an AP value can be calculated for each target in the target detection model, and the mAP value of the model can be obtained by averaging all the AP values.

Taking PR-curve as an example, we can see that the mean average accuracy of our model on the validation set is 0.628. From the analysis of the training results and the data set, there are many interference samples, which are easy to cause false detection. Among them, many plant leaves are very close. Due to the shooting angle and light, it is difficult to distinguish them in actual detection (for example: tomato leaves, potato leaves, etc. ), it is easy to cause false detection of the model.
3. 农作物叶片检测识别
在训练完成后得到最佳模型,接下来我们将帧图像输入到这个网络进行预测,从而得到预测结果,预测方法(predict.py)部分的代码如下所示:
def predict(img):
    img = torch.from_numpy(img).to(device)
    img = img.half() if half else img.float()
    img /= 255.0
    if img.ndimension() == 3:
        img = img.unsqueeze(0)

    t1 = time_synchronized()
    pred = model(img, augment=False)[0]
    pred = non_max_suppression(pred, opt.conf_thres, opt.iou_thres, classes=opt.classes,
                               agnostic=opt.agnostic_nms)
    t2 = time_synchronized()
    InferNms = round((t2 - t1), 2)

    return pred, InferNms
得到预测结果我们便可以将帧图像中的目标框出,然后在图片上用opencv绘图操作,输出农作物叶片的类别及农作物叶片的预测分数。以下是读取农作物叶片图片并进行检测的脚本,首先将图片数据进行预处理后送predict进行检测,然后计算标记框的位置并在图中标注出来。
if __name__ == '__main__':
    img_path = "./UI_rec/test_/18183295-H_jpg.rf.a24d4bca5c28d0089402702a47506c37.jpg"
    image = cv_imread(img_path)
    image = cv2.resize(image, (850, 500))
    img0 = image.copy()
    img = letterbox(img0, new_shape=imgsz)[0]
    img = np.stack(img, 0)
    img = img[:, :, ::-1].transpose(2, 0, 1)  # BGR to RGB, to 3x416x416
    img = np.ascontiguousarray(img)

    pred, useTime = predict(img)

    det = pred[0]
    p, s, im0 = None, '', img0
    if det is not None and len(det):  # 如果有检测信息则进入
        det[:, :4] = scale_coords(img.shape[1:], det[:, :4], im0.shape).round()  # 把图像缩放至im0的尺寸
        number_i = 0  # 类别预编号
        detInfo = []
        for *xyxy, conf, cls in reversed(det):  # 遍历检测信息
            c1, c2 = (int(xyxy[0]), int(xyxy[1])), (int(xyxy[2]), int(xyxy[3]))
            # 将检测信息添加到字典中
            detInfo.append([names[int(cls)], [c1[0], c1[1], c2[0], c2[1]], '%.2f' % conf])
            number_i += 1  # 编号数+1

            label = '%s %.2f' % (names[int(cls)], conf)

            # 画出检测到的目标物
            plot_one_box(image, xyxy, label=label, color=colors[int(cls)])
    # 实时显示检测画面
    cv2.imshow('Stream', image)
    # if cv2.waitKey(1) & 0xFF == ord('q'):
    #     break
    c = cv2.waitKey(0) & 0xff

执行得到的结果如下图所示,图中农作物叶片的种类和置信度值都标注出来了,预测速度较快。基于此模型我们可以将其设计成一个带有界面的系统,在界面上选择图片、视频或摄像头然后调用模型进行检测。

博主对整个系统进行了详细测试,最终开发出一版流畅得到清新界面,就是博文演示部分的展示,完整的UI界面、测试图片视频、代码文件,以及Python离线依赖包(方便安装运行,也可自行配置环境),均已打包上传,感兴趣的朋友可以通过下载链接获取。

下载链接
若您想获得博文中涉及的实现完整全部程序文件(包括测试图片、视频,py, UI文件等,如下图),这里已打包上传至博主的面包多平台,见可参考博客与视频,已将所有涉及的文件同时打包到里面,点击即可运行,完整文件截图如下:

在文件夹下的资源显示如下,下面的链接中也给出了Python的离线依赖包,读者可在正确安装Anaconda和Pycharm软件后,复制离线依赖包至项目目录下进行安装,离线依赖的使用详细演示也可见本人B站视频:win11从头安装软件和配置环境运行深度学习项目、Win10中使用pycharm和anaconda进行python环境配置教程。
注意:该代码采用Pycharm+Python3.8开发,经过测试能成功运行,运行界面的主程序为runMain.py和LoginUI.py,测试图片脚本可运行testPicture.py,测试视频脚本可运行testVideo.py。为确保程序顺利运行,请按照requirements.txt配置Python依赖包的版本。Python版本:3.8,请勿使用其他版本,详见requirements.txt文件;
完整资源中包含数据集及训练代码,环境配置与界面中文字、图片、logo等的修改方法请见视频,项目完整文件下载请见参考博客文章里面,或参考视频的简介处给出:➷➷➷
参考博客文章:https://zhuanlan.zhihu.com/p/614609445
参考视频演示:https://www.bilibili.com/video/BV1iT411r7ym/
离线依赖库下载链接:https://pan.baidu.com/s/1hW9z9ofV1FRSezTSj59JSg?pwd=oy4n (提取码:oy4n )
The method of modifying the text, icons and background images in the interface:
In Qt Designer, you can completely modify the controls and settings of the interface, and then convert the ui file into a py file to call and display the interface. If you only need to modify the text, icons and background images in the interface, you can modify them directly in the ConfigUI.config file. The steps are as follows:
(1) Open the UI_rec/tools/ConfigUI.config file. If there are garbled characters, please select GBK code to open.
(2) If you need to modify the interface text, just select the character you want to change and replace it with your own.
(3) If you need to modify the background, icons, etc., you only need to modify the path of the picture. For example, the background image in the original file is set as follows:
mainWindow = :/images/icons/back-image.png
It can be modified to your own image named background2.png (located in the UI_rec/icons/ folder), and the background image can be modified by setting this item as follows:
mainWindow = ./icons/background2.png
conclusion
Due to the limited ability of the blogger, even if the method mentioned in the blog post has been tested, it is inevitable that there will be omissions. I hope you can enthusiastically point out the mistakes, so that the next revision can be presented to everyone in a more perfect and rigorous manner. At the same time, if there is a better way to achieve it, please let me know.
Category of website: technical article > Blog
Author:Believesinkinto
link:http://www.pythonblackhole.com/blog/article/79608/e9564ab2e08d2eeb97e5/
source:python black hole net
Please indicate the source for any form of reprinting. If any infringement is discovered, it will be held legally responsible.
name:
Comment content: (supports up to 255 characters)
no articles