
Legend legend syntax and settings
posted on 2023-06-06 10:00 read(461) comment(0) like(30) collect(2)
(1) Set the legend position
Use the loc parameter
plt. legend (loc='lower left')
| 0 | ‘best’ |
| 1 | ‘upper right’ |
| 2 | ‘upper left’ |
| 3 | ‘lower left’ |
| 4 | ‘lower right’ |
| 5 | ‘right’ |
| 6 | ‘center left’ |
| 7 | ‘center right’ |
| 8 | ‘lower center’ |
| 9 | ‘upper center’ |
| 10 | ‘center’ |
(2) Set legend font
#Set font size
fontsize: int or float or {'xx-small', 'x-small', 'small', 'medium', 'large', 'x-large', 'xx- large'}
(3) Set the legend border and background
plt.legend(loc='best',frameon=False) #Remove the legend border
plt.legend(loc='best',edgecolor='blue') #Set the legend border color
plt.legend (loc='best',facecolor='blue') #Set the legend background color, if there is no border, the parameter is invalid
(4) Set the legend title
plt.legend(loc='best',title='figure 1 legend') #Remove the legend border
- Case: Set the legend legend outside the boundary of the graph
#主要是bbox_to_anchor的使用
box = ax1.get_position()
ax1.set_position([box.x0, box.y0, box.width , box.height* 0.8])
ax1.legend(loc='center', bbox_to_anchor=(0.5, 1.2),ncol=3)
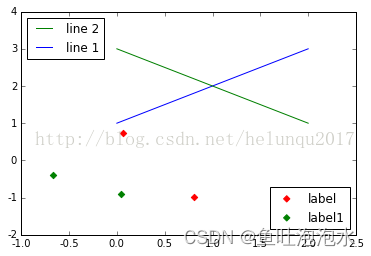
- Case: Display multiple legends
import matplotlib.pyplot as plt
import numpy as np
x = np.random.uniform(-1, 1, 4)
y = np.random.uniform(-1, 1, 4)
p1, = plt.plot([1,2,3])
p2, = plt.plot([3,2,1])
l1 = plt.legend([p2, p1], ["line 2", "line 1"], loc='upper left')
p3 = plt.scatter(x[0:2], y[0:2], marker = 'D', color='r')
p4 = plt.scatter(x[2:], y[2:], marker = 'D', color='g')
# This removes l1 from the axes.
plt.legend([p3, p4], ['label', 'label1'], loc='lower right', scatterpoints=1)
# Add l1 as a separate artist to the axes
plt.gca().add_artist(l1)
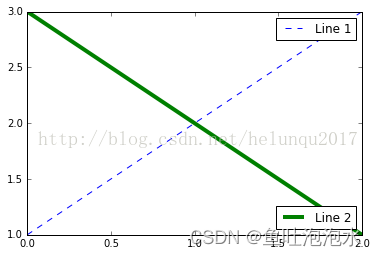
3. Case:
import matplotlib.pyplot as plt
line1, = plt.plot([1,2,3], label="Line 1", linestyle='--')
line2, = plt.plot([3,2,1], label="Line 2", linewidth=4)
# 为第一个线条创建图例
first_legend = plt.legend(handles=[line1], loc=1)
# 手动将图例添加到当前轴域
ax = plt.gca().add_artist(first_legend)
# 为第二个线条创建另一个图例
plt.legend(handles=[line2], loc=4)
plt.show()
The original link https://blog.csdn.net/helunqu2017/article/details/78641290 , thank the author for his hard work, only for notes, intrusion and deletion
Category of website: technical article > Blog
Author:Soledad
link:http://www.pythonblackhole.com/blog/article/79545/c010c1ff2c212247328e/
source:python black hole net
Please indicate the source for any form of reprinting. If any infringement is discovered, it will be held legally responsible.
name:
Comment content: (supports up to 255 characters)