
归一化处理
posted on 2023-05-07 20:50 read(1238) comment(0) like(27) collect(4)
1. Why is normalization necessary?
Example: Assuming a holiday forecast, the independent variable is the area, the number of rooms is two, and the dependent variable is the house price. get the equation:
Among them, it represents the number of rooms and
represents the area.
The process of finding the optimal solution in the experiment is the theta1 and theta2 that minimize the value of the loss function.
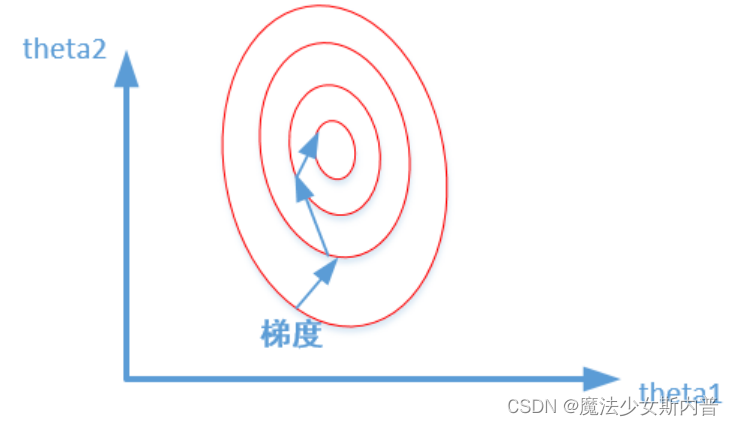
When the data is not normalized , the area number can range from 0 to 1000, and the number of rooms generally ranges from 0 to 10. It can be seen that the value range of the area number is much larger than the number of rooms. There is no normalized expression for the data, which can be:
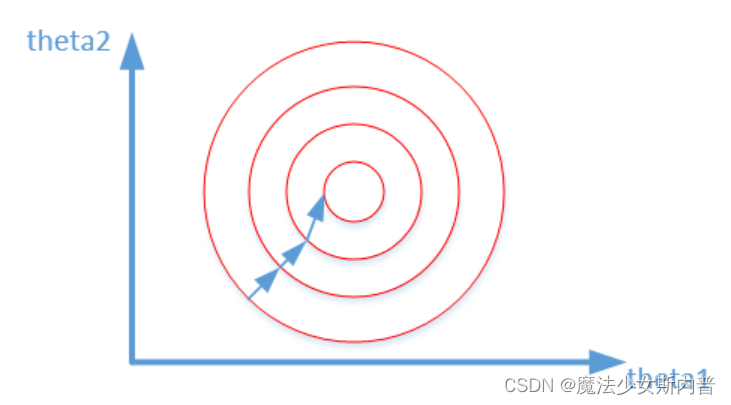
After the data is normalized , the expression of the loss function can be expressed as:
The two graphs represent the optimization process of the output results of whether the data is normalized, and the codes of the two graphs are the contour lines of the loss function.
Unnormalized: Normalized:
2. Benefits and purpose
It can be seen from the above that in the field of machine learning, different evaluation indicators (that is, different features in the feature vector are the different evaluation indicators described) often have different dimensions and dimensional units, which will affect the results of data analysis ,
In order to eliminate the dimensional influence between indicators, data standardization processing is required to solve the comparability between data indicators. After the original data is processed by data standardization, all indicators are in the same order of magnitude, which is suitable for comprehensive comparison and evaluation. Among them, the most typical is the normalization processing of data.
In short, the purpose of normalization is to limit the preprocessed data to a certain range (such as [0,1] or [-1,1]), so as to eliminate the adverse effects caused by singular sample data.
The existence of singular sample data will increase the training time and may also lead to failure to converge. Therefore, when there is singular sample data, the preprocessing data needs to be normalized before training; conversely, when there is no singular sample data , then no normalization is required.
- Purpose: Unify the evaluation results on different scales into one scale, so that comparisons and calculations can be made
- Benefits: 1) Speed up the speed of gradient descent to find the optimal solution, and speed up the convergence of the training network; 2) It is possible to achieve high precision
3. Normalization method
(1) Linear normalization. Also known as min-max standardization and dispersion standardization; it is a linear transformation of the original data, so that the result is mapped to [0,1]. The conversion function is as follows:

It is more suitable for situations where the values are relatively concentrated ; defect : if max and min are unstable, it is easy to make the normalization result unstable, making the effect of subsequent use unstable. In actual use, empirical constants can be used to replace max and min.
Application scenario: When the distance measurement, covariance calculation, and data do not conform to the normal distribution, the first method or other normalization methods (excluding the Z-score method ) can be used. For example, in image processing, after converting an RGB image to a grayscale image,
Limit its value to the range of [0 255]
(2) Z-score standardization

where μ and σ are the mean and means of the original dataset, respectively.
- Normalize the original dataset to a dataset with mean 0 and variance 1
- This normalization method requires that the distribution of the original data can be approximated as a Gaussian distribution, otherwise the effect of normalization will become very bad.
Application scenarios : In classification and clustering algorithms, Z-score standardization performs better when it is necessary to use distance to measure similarity, or when PCA technology is used for dimensionality reduction.
(3) Neural network normalization
This normalization method is often used in scenarios where the data differentiation is relatively large, some values are large, and some are small. Through some mathematical function, the original value is mapped.
This method includes log, tangent, etc., and needs to determine the curve of the nonlinear function according to the data distribution:
-
log logarithmic function normalization
y = log10(x)
That is, the logarithmic conversion function with base 10, the corresponding normalization method is:
x' = log10(x) /log10(max)
Where max represents the maximum value of the sample data, and all sample data must be greater than or equal to 1.
-
arctangent function normalization
x' = atan(x)*(2/pi)
When using this method, it should be noted that if the interval to be mapped is [0, 1], the data should be greater than or equal to 0, and the data less than 0 will be mapped to the [-1, 0] interval.
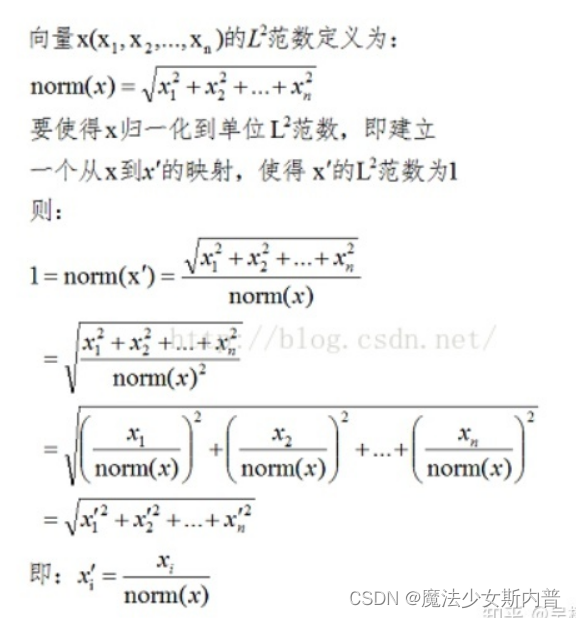
(4) L2 norm normalization
Definition: Each element in the feature vector is divided by the L2 norm of the vector:
4. Standardization and Normalization
- Difference: Standardization refers to processing the data into a data set with a mean of 0 and a standard deviation of 1 without changing the distribution of the data. Normalization refers to scaling the data to be in the [0,1] range.
- Differences and uses: Although normalization and standardization are both in the case of keeping the data distribution unchanged (why can the data distribution be kept unchanged? Because both are essentially just linear changes in the data), the data is processed, However, it can be clearly seen from the above formula that the normalization process is only related to the maximum and minimum values, while the standardization is related to the distribution of data (mean, variance), so the statistical significance of standardization is stronger, and it is for data scaling. processing preferred. It’s just that in some special scenarios, such as the need to scale the data to [0,1] (normalization does not guarantee the data range), and in some sparse data scenarios, if you want to keep the value of 0, you will use normalization, and other large Sometimes standardization is preferred.
5. When to use normalization
(1) If there is a requirement for the range of output results , use normalization.
(2) If the data is relatively stable and there are no extreme maximum and minimum values , use normalization.
(3) If there are outliers and a lot of noise in the data, using standardization can indirectly avoid the influence of outliers and extreme values through centralization.
【refer to】
1. What is normalization and standardization- Corporal Wendao- Blog Park
2. How to understand normalization? - Know about
3. Normalization of machine learning
Category of website: technical article > Blog
Author:Theheartoflove
link:http://www.pythonblackhole.com/blog/article/388/129f2dfdcc98e4172307/
source:python black hole net
Please indicate the source for any form of reprinting. If any infringement is discovered, it will be held legally responsible.
name:
Comment content: (supports up to 255 characters)
no articles