Matplotlib for python
posted on 2023-05-07 20:55 read(278) comment(0) like(2) collect(0)
1. What is data visualization ?
Data visualization is to convert data into information images such as graphs or tables, and to display and present data in a more intuitive way. Visualization is to express effectively through graphical means, to convey certain information accurately, efficiently, concisely and comprehensively, It even helps us discover certain laws and characteristics, and mine the value behind the data.
2. What is Matplotlib?
matplotlib is a Python software package for data visualization. It supports cross-platform operation. It can draw 2D (3D) images based on Numpy ndarray arrays. It is simple to use and the code is clear and easy to understand. It is loved by the majority of technology enthusiasts.
优点:
- Matplootlib provides a set of API interface for drawing object programming
- Relying on Python, with the powerful scalability of Python, Matplotlib can be used in many different environments
- Based on Matlab and object-oriented, completely free
- Matplotlib implements almost completely autonomous control over figure definition functions
pip install:
pip install matplotlib
comes with Anaconda
常见Matplotlib全局初始化设置:
# 修改全局字体设置,为支持中文的字体
plt.rcParams['font.sans-serif'] =['SimHei']
# 中文负号
plt.rcParams['axes.unicode_minus']=False
# 修改全局画布对象的分辨率
plt.rcParams['figure.dpi'] =100
# 修改全局画布对象的大小为500X300px
plt.rcParams['figure.figsize']=(5,3)
3. The basic method of matplotlib
| method name | illustrate |
|---|---|
| title() | Set the name of the chart |
| xlabel | Set the name of the x-axis |
| ylabel | Set the name of the y-axis |
| xticks(ticks,label,rotation) | Set the scale of the x-axis, rotation rotation angle |
| yticks() | Set the scale of the y-axis |
| show() | show icon |
| legend() | show legend |
| text(x,y,text) | Display the value of each data |
How to write the title or axis into Chinese?
Chinese is not supported by default: missing from current font The font is missing, so you need to modify the font configuration:
plt.rcParams[“font.sans-serif”]
字体说明:
| Chinese font | illustrate |
|---|---|
| 'SimHey' | Chinese bold |
| 'stop' | Chinese italics |
| 'LiSu' | Chinese official script |
| "Fang Song" | Chinese imitation Song |
| 'You Yuan' | Chinese Youyuan |
| STSong | Chinese Song Typeface |
临时设置成中文字体:
plt.rcParams['font.sans-serif'] = ['SimHei']
When the font is set to support Chinese, the symbol must be set, otherwise, when there is a negative value in the value, the negative sign cannot be displayed: :
解决方式 Modify the negative sign encoding in the axis, do not use the unicode negative sign, axes means all axes (x and y axes)
plt.rcParams['axes.unicode_minus'] = False
显示中文问题: Need to modify 2 configuration information:
plt.rcParams['font.sans-serif'] = ['SimHei']#用来设置字体样式以正常显示中文标签
plt.rcParams['axes.unicode_minus'] = False#默认使用Unicode负号,设置成正常显示字符
xlabel and ylabel
For the above picture, if you feel that the font is too small or the lines are too thin, you can set the label text size
fontsize parameter: set the text size
linewidth parameter: set the line
示例代码
plt.rcParams['font.sans-serif'] = ['SimHei']
# 解决方式:修改轴中负号编码axis
plt.rcParams['axes.unicode_minus'] = False
y1 = x
plt.title('y 等于 x的平方')
plt.xlabel('自变量x',fontsize = 16)
plt.ylabel('因变量y')
plt.plot(x,y,linewidth=5)
plt.plot(x,y1)
Set the scale of x-axis and y-axis
格式:
matplotlib.pyplot.xticks(ticks=None,labels = None,**kwargs)
参数解释:
- ticks: This parameter is a list of xtick positions. If an empty list is passed as parameter, then it will remove all xticks
- label: This parameter contains the label for the given tick mark position.
-
-
- kwargs: This parameter is a text attribute used to control the appearance of the label
- rotation: rotation angle
- color: color
-
show chart show()
Legend legend()
The legend is a description of the content and indicators represented by various symbols and colors on the map concentrated on one corner or one side of the map, which helps to better understand the map.
格式:
plt.legend(handles, labels,loc)
eg:ax.legend([line1, line2, line3], [‘label1’, ‘label2’, ‘label3’])
>>More parameters, please inquire on the official website
Display the position of the value x and y of each piece of data
格式:
plt.text(x,y,string,fontsize = 15,verticalalignment = ‘top’,herizontalalignment = ‘right’)
Visibility of other elements
1. Display grid: plt.griid()
格式:
plt.grd(True,linestyle = ‘–’,color = “gray”,linewidth=“0.5”,aixs =“x”)
参数解释:
- Whether to display the grid
- linstyle: line style
- color: color
- linewidth: width
- axis:x,y,both; grid showing x/y/both
2. Operation on coordinate axes: plt.gac()
First observe the coordinate axes on the canvas, as shown in the figure below:

In the above picture, the brown bounding box marked in red is called spines in Matplotlib, and the Chinese translation is spine.
In layman's terms, these bounding box lines are the four "pillars" of this area of the coordinate axis.
Therefore, we take In the end, what needs to be moved is actually these four "pillars"
and all operations are completed in plt.gac(), gca means get current axes , and the code is shown:
x = np.arange(-50,51)
y = x**2 + 1
# 获取当前坐标轴
ax = plt.gca()
print(ax)
# 通过坐标轴spines,确定top,bootom,left,right(分别表示上下左右四根支柱)
# 不需要右侧和上侧线条,则可以设置它的颜色为none
ax.spines['right'].set_color('none')
ax.spines['top'].set_color('none')
# 移动左轴到指定位置
# 在这里,position参数有三类型:data,outward(向外),axes

# axes:代表移动整个轴的比例,区间咋0.0 - 1.0之间的值
# ax.spines['left'].set_position(('axes',0.5))

# 'data':表示按数值移动,其后跟的数字代表移动到y轴的刻度,因此也可以这样写:
ax.spines['left'].set_position(('data',0))

# 发现y轴没有跟x轴对齐,可以直接移动x轴的位置
# ax.spines['bottom'].set_position(('data',0))

# 也可以通过设置y轴的z坐标区间来保持对齐
plt.ylim(0,y.max())
plt.plot(x,y)
plt.show()
3. Style parameter settings in Matplotlib
1. Line style
Pass in xy, draw a picture through plot, and set the polyline color, transparency, polyline style and polyline width. Mark point, mark point size, mark point edge color, mark point edge width. Grid
格式:
plt.plot(x,y,color =‘red’,alpha=0.3,linestyle=“-”,linewidth=5,marker=‘o’,markeredgecolor=‘r’,marersize= ‘20’,markeredgewidth=10)
-
- color : you can use color
16进制, you can also use line color英文, you can also use English缩写:
- color : you can use color
| abbreviation | color | full name |
|---|---|---|
| ‘b’ | blue | blue |
| ‘g’ | green | green |
| ‘r’ | red | red |
| ‘c’ | blue | cyan |
| ‘m’ | magenta | magenta |
| 'and' | yellow | yellow |
| ‘k’ | black | balack |
| 'In' | White | white |
-
- alpha : Transparency, value 0-1
-
- linestyle : polyline style
| character | describe |
|---|---|
| '-' | solid line |
| '–' | dotted line |
| '-.' | Dotted line |
| ':' | dotted line |
-
- marker : Marker point style:
| mark symbol | describe |
|---|---|
| '.' | point marker |
| 'O' | the circle |
| ‘x’ | "X" mark |
| ‘D’ | diamond mark |
| ‘H’ | hex mark |
| ‘s’ | square mark |
| '+' | plus |
示例代码:
x = np.arange(0,100,10)
y = x ** 2
plt.plot(x,y,linewidth='1',label='test',color = 'r',linestyle='--',marker = 'H')
plt.legend(loc = 'upper left')
plt.show()
4. Create graphic objects
In Matplotlib, the core idea of object-oriented programming is to create 图形对象(figure object). Call other methods and properties through image objects, which helps us better purchase and suffer from multiple canvases. In this process, pyplot is responsible for generating graphics Object, and add one or more axes objects (ie, the drawing area) through the object.
Matplotlib provides the matplotlib.figure graphics class module, which contains the method of creating image objects. By calling the figure() function in the pyplot module to instantiate the figure object.
1. Create a graphic object
The figure method is as follows:
plt.figure(
    num=None,#图像编号或名称,数字为编号,字符串为名称
    figsize=None,#指定figure的宽和高,单位为英寸
    dpi=None,#指定绘图对象的分辨率,即没英寸多少个像素,缺省值为72
    facecolor=None,#背景颜色
    edgecolor=None,#边框颜色
    frameon=True,#是否显示边框
    **kwargs,
)
示例代码:
x = np.arange(0,50)
y = x**2
# 创建图形对象
fig = plt.figure('f1',figsize=(6,4),dpi=100,facecolor='gray')
plt.plot(x,y)
plt.show()
5. Draw multiple subgraphs
A figure is a drawing object (which can be understood as a blank canvas). A figure object can contain multiple Axes subgraphs. An Axes is a drawing area. When not set, Axes=1, and each drawing is on the figure Drawing on the Axes.
The following will introduce 几种绘制子图的方式:
- add_axes(): add area
- subplot(): Divide the canvas equally, just create a canvas containing the subplot area (return area object)
- subplots(): Creates both a canvas containing a subplot area and a figure graphic object. (returns a graphic object and an area object)
1.add_axes(); add area
Matplotlib defines an axes class (axes class), and objects of this class are called axes objects (that is, axes objects), which specify a drawing area with a numerical range limit. Multiple axes objects can be included in a given figure, but the same axes object can only be used in one canvas.
The 2D drawing area (axes) contains two axes (axis) objects
语法格式:
add_axes(rect):
- This method is used to generate an axes axis object, and the position of the object is determined by the parameter rect
- rect is a positional parameter that accepts a list of floating point numbers consisting of 4 elements, in the form of [left, bottom, width, height], which represents the coordinates (x, y) of the lower left corner of the rectangular area added to the canvas, as well as the width and high
Note: The value of each element is a fraction of the canvas width and height. That is, the width and height of the canvas are regarded as 1 unit. For example, [0.2,0.2,0.5,0.5], it represents drawing from the position of 20% of the canvas, and the width and height are 50% of the canvas
演示代码:
fig = plt.figure(figsize=(4,2),dpi=200,facecolor='g')
# ax1从画布起始位置绘制,宽度和高度与画布一致
ax1 = fig.add_axes([0,0,1,1])
# 在ax1区域里面作画
x = np.arange(0,11,2)
y = 5*x + 1
ax1.plot(x,y,marker='D')
ax1.legend()
# ax2 从画布的20%位置开始绘制,宽高是画布的60%
ax2 = fig.add_axes([.2,.2,.6,.6])
# 在ax2区域里面作画
y2 = x**2 +3
ax = plt.gca()
ax.spines['top'].set_color('None')
ax.spines['right'].set_color('None')
ax.plot(x,y2)
2.subplot(): Divide the canvas evenly
格式:
ax = plt.subplot(nrows,ncols,index,*args,**kwargs)
参数解释:
- nrows: rows
- ncols: columns
- index: position index
- kwargs: title/xlabel/ylabel etc.
You can also write the values of several parameters together, such as: subplot(233)
返回: The area object
nrows and ncols indicate the sub-areas to be divided into several rows and columns (nrows'nclos indicates the number of sub-graphs), and the initial value of index is 1, which is used to select a specific sub-area. For example: subplot(233)
means Create a drawing area with two rows and three columns in the upper right corner of the current canvas (as shown in the figure below), and at the same time, choose to draw a subgraph at the third position.
Notice:
plot(y), the parameter x can be omitted, the default is from [0,...,N-1], N is the number of elements on the y-axis
Example code:
ax1 = plt.subplot(211)
ax1.plot(range(50,70),marker='o')
ax1.grid()
ax2 = plt.subplot(212)
ax2.plot(np.arange(12)*2)
Notice:
If the new subgraph overlaps the existing subgraph, the overlapping subgraph will be automatically deleted, because they cannot share the drawing area axes
Example code:
plt.plot([1,2,3])
# 现在创建一个子图,他表示一行二列的网格顶部
# 因为这个子图将于第一个重叠,所以之前创建的图将被自动删除
plt.subplot(211)
plt.plot(range(50,70))
plt.subplot(212)
plt.plot(np.arange(12)*2)
# Auto-removal of overlapping axes is deprecated since 3.6 and will be removed two minor releases later; explicitly call ax.remove() as needed.
If you don't want to overwrite the previous graph, you need to create a canvas first:
实例代码:
plt.plot([1,2,3,4])
# 还可以设置画布大小,再通过画布创建区域
fig = plt.figure(num = 'f1',figsize=(6,4),dpi=200)
ax1 = fig.add_subplot(111)
plt.plot(range(20))
ax2 = fig.add_subplot(221)
plt.plot(range(12))
3. The basic way to set multi-map:
3.1 Set directly at the beginning of creation
For viewing the subplot keyword assignment parameters, you can move the cursor to the subplot method and use shift+tab to view the specific content.
示例代码:
fig = plt.figure('f1',figsize=(20,10),dpi=200,facecolor='r',edgecolor='b',frameon=True)
ax1 =fig.add_subplot(211,title = 'f1.upper',xlabel='x axies',ylabel='y axies')
ax1.plot(range(50,70),linewidth= 2)
ax2 = fig.add_subplot(212,title='f1.lower',xlabel='x axise', ylabel='y axies')
plt.plot(np.arange(12)**2)
#紧凑的布局处理:
plt.tight_layout()
If it is found that the subgraph titles overlap, call at the end:
plt.tight_layout()
3.2 After setting using the method in the pyplot module, draw
示例代码:
# 第一区域
plt.subplot(211)
plt.title('ax1')
plt.xlabel('x axies')
plt.ylabel('y axies')
plt.plot(np.arange(12)**2)
# 第二区域
plt.subplot(212)
plt.title('ax2')
plt.plot(range(20,30,2))
plt.tight_layout()
3.3 Using the returned area object settings
注意:
Many methods of area objects start with set_
set area object will not exist set position
代码示例:
fig = plt.figure()
ax1 = fig.add_subplot(211)
ax2 = fig.add_subplot(212)
# 第一个区域的设置
ax1.set_title('ax1')
ax1.plot(range(20,30))
# 第二个区域设置
ax2.set_title('ax2')
ax2.plot(np.arange(12)**2)
plt.tight_layout()
4. Detailed explanation of subplots() function
The matplotlib.pyplot module provides a subplots() function, which is used in a similar way to the subplot() function. The difference is that subplots() creates both a canvas axes containing the subplot area and a figure graphic object, while subplot() just creates a canvas containing the subplot area.
subplots() function format:
fig,ax = plt.subplots(nrows,ncols)#nrows and ncols specify the number of rows/columns occupied by the subplot
函数的返回值是一个元组,包括一个图形对象和所有的axes对象(即axes二维数组).其中axes对象的数量等于nrows * ncols,且每个axes对象均可以通过索引值访问(从0开始).
如下2行2列数据:
fig,axes = plt.subplots(2,2)
x = np.arange(1,5)
# 绘制平方图像
ax1 = axes[0][0]
ax1.set_title('squrare')
ax1.plot(x,x**2)
# 绘制平方根函数
ax2 = axes[0,1]
ax2.set_title('sqrt')
ax2.plot(x,np.sqrt(x))
# 绘制指数函数
ax3 = axes[1,0]
ax2.set_title('exp')
ax3.plot(x,np.exp(x))
# 绘制对数函数
ax4 = axes[1,1]
ax4.set_title('log')
ax4.plot(x,np.log10(x))
复杂的多个子图画法:

fig = plt.figure()
ax1 = fig.add_subplot(321,facecolor='r')
ax2 = fig.add_subplot(322,facecolor='r')
ax3 = fig.add_subplot(323,facecolor='r')
ax4 = fig.add_subplot(324,facecolor='r')
ax5 =fig.add_subplot(313,facecolor='g')

代码:
fig = plt.figure()
fig.add_subplot(121,facecolor='r')
fig.add_subplot(222,facecolor='g')
fig.add_subplot(224,facecolor='g')
5.不同种类的图
5.1柱状图的绘制
柱状图显示的是不同类别之间的比较关系,高度与其代表的值成正比,水平x轴被指定比价的类别,垂直y轴则表示对应的值。
柱状图可以水平绘制,也可以垂直绘制。
格式:
matplotlib.pyplot.bar(x,height,width:float = 0.8, noottom = None,align:str = ‘center’,data = None,**kwargs)
参数解释:
| 参数 | 作用 |
|---|---|
| x | 表示x轴坐标,类型为float类型,一般为np.arange()生成的固定步长列表 |
| height | 表示柱状图的高度,也就是y的值,类型为float,一般为一个列表,包含生成柱状图的所有值 |
| width | 表示柱状图的宽度,取值范围在0=1,默认0.8 |
| bottom | 柱状图的起始位置,也就是y轴坐标值的起始位置,默认None |
| align | 柱状图的中心位置,可选值为“center”/“lege”,默认值为center |
| color | 柱状图颜色,默认为蓝色;facecolor=’r’,color = [‘r’,‘g’,‘b’] |
| alpha | 透明度,取值范围在0~1,默认值1 |
| label | 标签,设置后需要调用plt.lengend |
| edgecolor | 边框颜色,缩写ec |
| linewidth | 边框宽度,浮点数或类数组,默认为None,缩写lw |
| tick_label | 柱子的刻度标签,字符串或字符串列表,默认值为None |
| linestyle | 线条样式,缩写ls |
代码实例:
x = range(5)
data = [5,20,15,10,25]
# 设置标题
plt.title('基本柱状图')
plt.rcParams['font.sans-serif'] = ['SimHei']#用来设置字体样式以正常显示中文标签
plt.rcParams['axes.unicode_minus'] = False
plt.grid(ls= '--',alpha=0.5)
# plt.bar(x,data,bottom=[10,5,20,0,10],facecolor=['r','g','b',])
plt.bar(x,data,ec='c',ls='-',lw='2',bottom=[10,5,20,0,10],color=['r','g','b',])
5.2 同一位置多柱状图的绘制
同一x轴绘制多个柱状图,主要通过调整柱状图的宽度和每个柱状图x轴的起始位置
步骤:
- 本实例需要对x轴进行计算,因此需要将x轴转数值
- 确定同一x轴中,每个柱状图x轴的起始位置。
- 需要设置图形的宽度
- 图形2的起始位置=图形2起始位置+图形的宽度
- 图形3的起始位置=图形3起始位置+2倍图形的宽度需-要给每个柱状图循环显示文本内容
- 显示图例
案列:

代码:
country = ['挪威','德国','中国','美国','瑞典']

#
gold_medal = [16,12,9,8,8]
silver_medal = [8,10,4,10,5]
bronze_medal = [13,5,2,7,5]

# 将x轴转换为数值
x = np.arange(len(country))
# 设置条形宽度
width = 0.2
# 确定各个类型条形图的起始位置
# 金牌起始位置
gold_x = x
#银牌
silver_x = x + width
# 铜牌
bronze_x = x + 2*width
# 金牌图形
plt.bar(gold_x,gold_medal,width=width,color='gold')
# 银牌图形
plt.bar(silver_x,silver_medal,width=width,color='silver')
# 铜牌
plt.bar(bronze_x,bronze_medal,width=width,color='brown')
# 将x轴标签居中
plt.xticks(x+width,labels=country)
# 显示每个条形图高度数值
for i in range(len(country)):
    plt.text(gold_x[i],gold_medal[i],gold_medal[i],va='bottom',ha='center')
    plt.text(silver_x[i],silver_medal[i],silver_medal[i],va='bottom',ha='center')
    plt.text(bronze_x[i],bronze_medal[i],bronze_medal[i],va='bottom',ha='center')
5.3 堆叠柱状图的绘制
所谓堆叠柱状图就是将不同数组别的柱状图堆叠在一起,堆叠后的柱状图高度显示了两者相加的结果值。
案列:

代码演示:
country = ['挪威','德国','中国','美国','瑞典']
#
gold_medal = [16,12,9,8,8]
silver_medal = [8,10,4,10,5]
bronze_medal = [13,5,2,7,5]
# 设置x轴坐标
x = np.arange(len(country))
#计算不同数值的起始高度
# 铜牌起始位置
bronze_y = [0]*len(country)
# 银牌起始位置
silver_y = bronze_medal
# 金牌起始位置
gold_y = np.array(silver_y) + np.array(silver_medal)

# 绘图
line1=plt.bar(x,bronze_medal,width=0.6,bottom=bronze_y,align='center',color ='brown')
line2=plt.bar(x,silver_medal,width=0.6,bottom=silver_y,align='center',color ='silver')
line3=plt.bar(x,gold_medal,width=0.6,bottom=gold_y,align='center',color ='gold')
# 设置x轴刻度和label
plt.xticks(x,country)
# 设置图例
plt.legend([line1,line2,line3],['铜牌','银牌','金牌'])
5.4 水平柱状图的绘制
调用Matplotlib.pyplot的barh()函数可以生成水平柱状图
barh()函数的用法与bar()函数的用法基本一样,只是在调用barh()函数时使用y参数传入Y轴数据,使用width参数传入代表条柱宽度的数据。
格式:
plt.barh(y, width,height=0.8,left=None,, align=‘center’, * kwargs)
案列:

代码示例:
   movie = ['新蝙蝠侠','狙击手','奇迹笨小孩']
   day1 = [4053,2548,1543]
   day2 = [7840,4013,2421]
   day3 = [8080,3673,1342]
   x = np.arange(len(movie))
   # day1的起始宽度
   d1w = np.zeros(len(movie),dtype=int)
   # day2的起始宽度
   d2w = np.array(day1)
   # day3的起始宽度
   d3w = np.array(day2)+d2w
   l1 = plt.barh(movie,width=day1,height=0.2,left=d1w)
   l2 = plt.barh(movie,width=day2,height=0.2,left=d2w)
   l3 = plt.barh(movie,width=day3,height=0.2,left=d3w)
   sum_data = np.array(day1)+np.array(day2)+np.array(day3)
   # horizontalignment垂直,左边、中间或右边
   # verticalalignment控制y位置参数,底部、中心或顶部
   for i in range(len(movie)):
       plt.text(sum_data[i],movie[i],sum_data[i],ha='left',va ='center')
   plt.xlim(0,sum_data.max()+2000)
绘制多位置柱状图:

步骤:
- 由于需要计算高度,所以需要将y轴转换为数值型
- 需要设置同图形的高度
- 计算每个图形的起始高度
- 绘制图形
- 替换y轴刻度和label
代码示例:
    movie = ['新蝙蝠侠','狙击手','奇迹笨小孩']
    day1 = np.array([4053,2548,1543])
    day2 = np.array([7840,4013,2421])
    day3 = np.array([8080,3673,1342])
    # 将y轴转换为数值型
    num_y = np.arange(len(movie))
    # 设置条形图的高度
    height = 0.2
    # 计算每个图形起始的高度
    dh1 = num_y
    dh2 = num_y+height
    dh3 = num_y+height*2
    # 绘制图形
    l1 = plt.barh(dh1,day1,height=height)
    l2 = plt.barh(dh2,day2,height=height)
    l3 = plt.barh(dh3,day3,height=height)
    # 将y轴刻度和label改变
    plt.yticks(x+height,labels=movie)
    # 图例
    plt.legend([l1,l2,l3],movie)
    for i in range(len(movie)):
        plt.text(day1[i],dh1[i],day1[i],va='center')
        plt.text(day2[i],dh2[i],day2[i],va='center')
        plt.text(day3[i],dh3[i],day3[i],va='center')
    plt.xlim(0,np.array([day1.max(),day2.max(),day3.max()]).max()+2000)
5.5 直方图的绘制plt.hist()
直方图(Histogram),又称质量分布图,它是一种条形图的一种,由一系列高度不等的纵向线段来表示数据分布的情况。直方图的横轴表示数据类型,纵轴表示分布情况。
首先,我们需要了解柱状图和直方图的区别。直方图用于概率分布,它显示了一组数值序列在给定的数值范围内出现的概率;而柱状图则用于展示各个类别的频数。
直方图和柱状图的区别:
| 柱状图 | 直方图 |
|---|---|
| 柱状图一般用于描述离散型分类数据的对比 | 直方图一般用于描述连续型数据的分布关系 |
| 每根柱子宽度固定,柱子之间会有间距 | 每根柱子宽度固定,柱子之间没有间距 |
| 横轴变量可以任意排序 | 横轴变量有—定顺序规则 |
将统计值的范围分段,即将整个值的范围分成一系列间隔,然后计算每个间隔中有多少值。直方图也可以被归一化以显示°相对频率。然后,它显示了属于几个类别中的每个类别的占比,其高度总和等于1。
格式:
plt.hist(x,bins =None,range=None,density=None,weights =None,cumulative=False,bottom=None,histtype=‘bar’,align=‘mid’,orientation=‘vertical’,rwidth=None,log=Fasle,color=None,label=None,stacked=False,normed =None)
参数解释:
- x:作直方图所要用的数据,必须是一维数组;多维数组可以先进行扁平化再作图;必选参数;
- bins:直方图的柱数,即要分的组数,默认为10;
- weights:与x形状相同的权重数组;将x中的每个元素乘以对应权重值再计数;如果normed或density取值为True,则会对权重进行归一化处理。这个参数可用于绘制已合并的数据的直方图;
- density:布尔,可选。如果"True",返回元组的第一个元素将会将计数标准化以形成一个概率密度,也就是说,直方图下的面积(或积分)总和为1。这是通过将计数除以数字的数量来实现的观察乘以箱子的宽度而不是除以总数数量的观察。如果叠加也是“真实"的,那么柱状图被规范化为1。(替代normed)
- bottom:数组,标量值或None;每个柱子底部相对于y=O的位置。如果是标量值,则每个柱子相对于y=O向上/向下的偏移量相同。如果是数组,则根据数组元素取值移动对应的柱子;即直方图上下便宜距离;
- histtype: {bar , 'barstacked ', 'step , 'stepfilled}; 'bar’是传统的条形直方图; ‘barstacked’是堆叠的条形直方图; ‘step’是未填充的条形直方图,只有外边框; ‘stepfilled’是有填充的直方图;当hittype取值为’step或’stepfilled’,width设置失效,即不能指定柱子之间的间隔,默认连接在一起;
- align: {left , 'mid ', right)}; "left: 柱子的中心位于bins的左边缘;‘mid’: 柱子位于bins左右边缘之间;‘right’: 柱子的中心位于bins的右边缘
- color:具体颜色,数组(元素为颜色)或None。
- label:字符串(序列)或None;有多个数据集时,用label参数做标注区分;
- normed:是否将得到的直方图向量归一化,即显示占比,默认为O,不归一化;不推荐使用,建议改用density参数;
- edgecolor:直方图边框颜色;
- alpha:透明度;
返回值:
- ndarry:数组或数组列表,代表直方图每个bin代表的值
- bins:返回各bin的区间起始位置的值和结束值,注意这里的数组比ndarray多一个
- patches:返回每个bin里面包含的数据
代码演示:
    x = np.random.randint(120,181,300)
    # 绘制直方图
    num,bins, pathches = plt.hist(x,bins=10,color='r',edgecolor='g')
    print(num)
    print(bins)
    print(pathches)
    for item in pathches:
        print(item)
        print(item.get_x())
        print(item.get_width())
        print(item.get_height())
添加折线图
在直方图中,我们也可以加一个折线图,辅助我们查看数据变化情况:
- 首先通过pyplot.subplots()创建Axes对象
- 通过Axes对象调用hist()方法绘制直方图,返回折线图所需要的下x,y数据
- 然后Axes对象调用plot()绘制折线图

代码示例:
    x = np.random.randint(120,181,300)
    # 绘制直方图
    num,bins, pathches = plt.hist(x,bins=10,color='r',edgecolor='g')
    print(num)
    print(bins)
    print(pathches)
    plt.plot(bins[:10],num,'--',marker='o')
不等距分组
上面讲的直方图都是等距的,有时候我们需要不等距的直方图,这时候只需要确定分组的上下限就可以了
代码演示:
    fig,ax= plt.subplots()
    x = np.random.normal(100,20,100)#均值和方差
    bins = [50,60,70,90,100,110,140,150]
    ax.hist(x,bins,color='b',edgecolor='w')
    ax.set_xticks(bins,labels=bins)
多类型直方图
我们在使用直方图查查看数据的频率时,有时候会查看多种类型数据出现的频率。
这时候,我们需要列表嵌套的形式传入给hist()方法的x参数

代码演示:
    n_bins = 10
    fig,ax = plt.subplots()
    x_multi = [np.random.randn(n) for n in [10000,5000,2000]]
    # 在实际绘图代码中羽单类型差别不大,只是增加一个图例项
    # 要在hist()函数中先指定图例label
    ax.hist(x_multi,n_bins,histtype='bar',label=['A','B','C'])
ax.legend()
堆叠直方图
我们有时候会对吧同样数据范围情况下,对比两组不同对象群体收集的数据差异

注意点:
- 直方图属性data:以列表的形式传入两组数据
- 设置直方图stacked:为True,允许数据覆盖
代码演示:
x1 = np.random.randint(180,200,200)
x2 = np.random.randint(180,200,200)
plt.hist([x1,x2],bins=10,stacked=True,edgecolor='w')
5.6 饼状图plt.pie()
饼状图用来显示一个数据系列,具体来说,饼状图显示一个数据系列中各项目的占项目总和的百分比。
Matplotlib.pyplot,提供了一个pie()函数,该函数可以生成数组中数据的饼状图。您可使用x/sum(x)来计算各个扇形区域占饼图总和的百分比。pie()函数的参数说明如下:
格式:
pyplot.pie(x,explode=None,labels=None,colors=None,autopct=None)
参数解释:
- x:数组序列,数组元素对应扇形区域的数量大小。
- labels:列表字符串序列,为每个扇形区域备注一个标签名字。
- colors;为每个扇形区域设置颜色,默认按照颜色周期自动设置。
- autopct:格式化字符串"fmt%pct",使用百分比的格式设置每个扇形区的标签,并将其放置在扇形区内。注意:参数要用两个%包裹
- pctdistance:设置百分比标签与圆心的距离;
- labeldistance:设置各扇形标签(图例)与圆心的距离;
- explode:指定饼图某些部分的突出显示,即呈现爆炸式;
- shadow:是否添加饼图的阴影效果
设置饼状图百分比和文本距离中心位置:
- pctdistance:设置百分比标签与圆心的距离;
- labeldistance:设置各扇形标签(图例)与圆心的距离;

代码演示:
    plt.rcParams['figure.figsize'] = (5,5)
    # 定义饼 的标签
    labels = ['娱乐','育儿','饮食','房贷','交通','其它']
    # 每个标签所占的数量
    x = [200,500,1200,7000,200,900]
    # 饼状图分离
    explode = (0.03,0.05,0.06,0.04,0.08,0.1)
    # 绘制饼图
    plt.pie(x,labels=labels,autopct='%0.2f%%',explode=explode,shadow=True,labeldistance=1.1,pctdistance=1.4)
    # 图例
    plt.legend()
5.7散点图 plt.scatter()
散点图也叫X-Y图,它将所有的数据以点的形式展现在直角坐标系上,以显示变量之间的相互影响程度,点的位置由变量的数值决定。
通过观察散点图上数据点的分布情况,我们可以推断出变量间的相关性。如果变量之间不存在相互关系,那么在散点图上就会表现为随机分布的离散的点,如果存在某种相关性,那么大部分的数据点就会相对密集并以某种趋势呈现。
数据的相关关系主要分为:正相关(两个变量值同时增长)、负相关(一个变量值增加另一个变量值下降)、不相关、线性相关、指数相关等,表现在散点图上的大致分布如下图所示。那些离点集群较远的点我们称为离群点或者异常点。
格式:
mayplot.pyplot.sactter(x,y,s=None,marker=None,cmap=None,norm=None.vmln=None,vmax=None,alpha=None,linewidths=None,edgecolor=None,plotnonfinite=False,data=None,**kwargs)
参数解释:
- x, y→散点的坐标
- s→散点的面积
- c→散点的颜色(默认值为蓝色,"b’,其余颜色同plt.plot())
- marker→散点样式(默认值为实心圆,'o,其余样式同plt.plot( ))
- alpha→散点透明度([0,1]之间的数,0表示完全透明,1则表示完全不透明)
- linewidths→散点的边缘线宽
- edgecolors →散点的边缘颜色
- cmap → Colormap,默认None,标量或者是一个colormap 的名字,只有c是一个浮点数数组的时才使用
案列:

代码示例:
    # x 轴数据
    x = np.random.rand(50)#rand()生成一个[0,1)之间的随机浮点数
    # y轴数据
    y = np.random.rand(50)
    # 生成一个正态分布的浮点数数组,用来描述点的大小
    s = (10* np.random.randn(50))**2
    # 颜色也可以使用元组数字序列
    # 颜色随机
    color = np.random.rand(50)
    plt.scatter(x,y,s,c=color)
可以选择不同的颜色条范围–配合cmap参数
颜色条Colormap
Matplotlib模块提供了很多可用的颜色条。
颜色条就像一个颜色列表,其中每种颜色都有一个范围从О到100的值。
下面是一个颜色条的例子:viridis

#####cmap的分类
cmap主要分为以下四大类:、
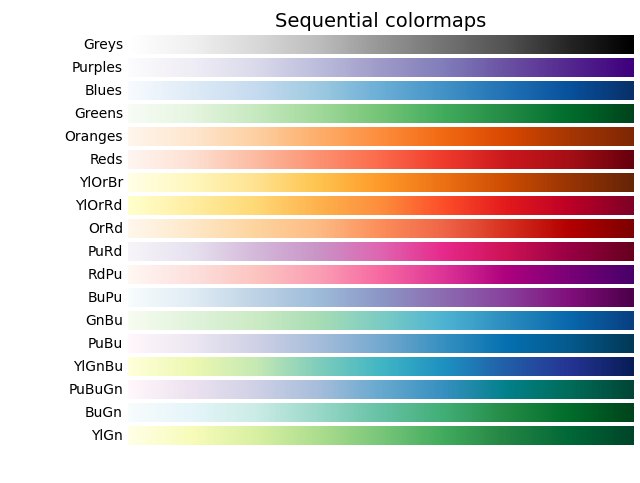
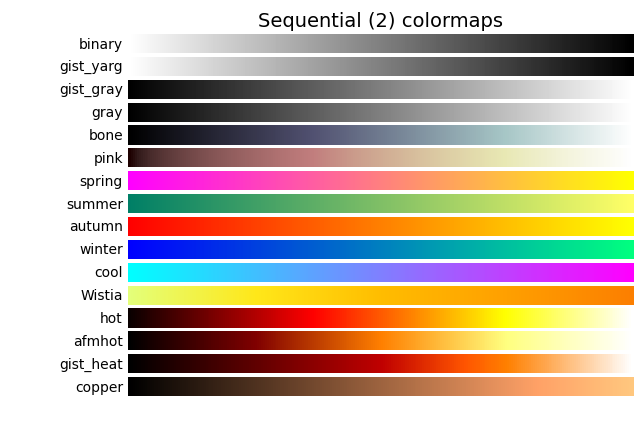
1.Sequential colormaps:连续化色图
特点:在两种色调之间近似平滑变化,通常是从低饱和度(例如白色)到高饱和度(例如明亮的蓝色)。
应用:适用于大多数科学数据,可直观地看出数据从低到高的变化。
-
1)以中间值颜色命名(eg: viridis松石绿):[‘viridis’, ‘plasma’, ‘inferno’, ‘magma’; ‘clvidis’]

-
2)以色系名称命名,由低饱和度到高饱和度过渡(eg: YIOrRd = yellow-orange-red,其它同理): [Greys’, ‘Purples’, ‘Blues’, ‘Greens’, ‘Oranges’,‘Reds’,‘YIOrBr’ , "YIOrRd’, ‘OrRd’, ‘PuRd’,‘RdPu’, ‘BuPu’, ‘GnBu’, ‘PuBu’, ‘YIGnBu’, ‘PuBuGn’, ‘BuGn’, ‘YIGn’, “binary’, ‘gilst_yarg’,‘gist_gray’, ‘gray’, ‘bone’, ‘pink’,‘spring’, ‘summer’, ‘autumn’, 'winter , 'coo”, ‘Wistia’,"hot’, ‘afmhot’glst_heat’, 'copper]


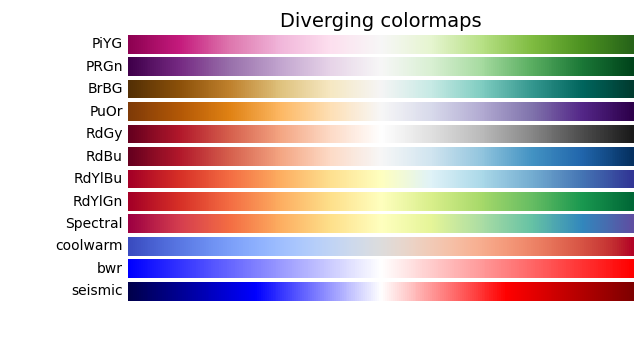
2. Diverging colormaps:两端发散的色图
- 特点:具有中间值(通常是浅色),并在高值和低值处平滑变化为两种不同的色调。
- 应用:适用于数据的中间值很大的情况(例如0,因此正值和负值分别表示为颜色图的不同颜色)。[‘PiYG’, ‘PRGn’, ‘BrBG’, ‘PuOr’, ‘RdGy’, ‘RdBu’, ‘RdYlBu’,‘RdYlGn’, ‘Spectral’, ‘coolwarm’, ‘bwr’, ‘seismic’]

3.Cyclic colormaps:周期图
对于周期图,我们希望以相同的颜色开始和结束,并满足 中间对称的中心点。可选参数:
[‘twilight’, ‘twilight_shifted’, ‘hsv’]

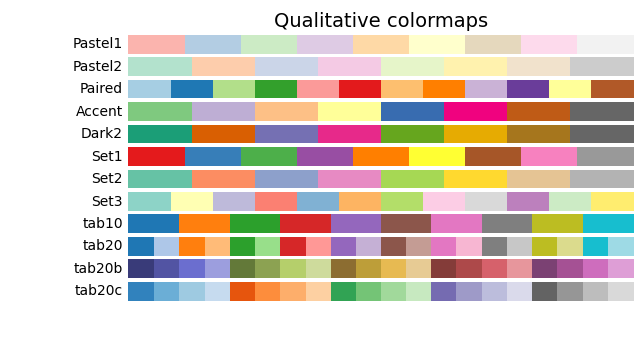
4.Qualitative colormaps:离散化色图
特点:离散的颜色组合
应用:在深色背景上绘制一系列线条时,可以在定性色图中选择一组离散的颜色,参数:[‘Pastel1’, ‘Pastel2’, ‘Paired’, ‘Accent’, ‘Dark2’,‘Set1’, ‘Set2’, ‘Set3’, ‘tab10’, ‘tab20’, ‘tab20b’,‘tab20c’]

更多信息请参考,官网
5.8保存图片pyplot.savefig()
格式:
pyplot.savefig(fname,dpi=None,facecolor=‘w’,edgecolor=‘w’,orientation=‘portrait’.papertype=None,format=None,transparent=False,bbox+inches=None,pad_inches=0.1,frameon=None.metadata=None)
参数解释:
- fname:(字符串或者仿路径或仿文件)如果格式已经设置,这将决定输出的格式并将文件按fname来保存。如果格式没有设置,在fname有扩展名的情况下推断按此保存,没有扩展名将按照默认格式存储为“png”格式,并将适当的扩展名添加在fname后面。
- dpi:分辨率,每英寸的点数
- facecolor(颜色或“auto”,默认值是"auto")∶图形表面颜色。如果是"auto”,使用当前图形的表面颜色。
- edgecolor(颜色或“auto”,默认值:“auto"):图形边缘颜色。如果是“auto”,使用当前图形的边缘颜色。
- format(字符串)︰文件格式,比如“png”“,“pdf”,“svg”等,未设置的行为将被记录在fname中。
- transparent:用于将图片背景设置为透明。图形也会是透明,除非通过关键字参数指定了表面颜色和/或边缘
注意;
- plt.savefig()一定要写在plt.show()前面,不然保存的是空白图像
- 第一个路径参数如果报班不存在的文件夹会报错,可以使用os模块先创建文件夹再保存
5.9 词云图 WordCloud
wordcloud是什么?词云图,也叫文字云,是对文本中出现频率较高的“关键词"予以视觉化的展现,词云图过滤掉大量的低频低质的文本信息,使得浏览者只要一眼扫过文本就可领略文本的主旨。
WordCloud是一款python环境下的词云图工具包,同时支持python2和python3,能通过代码的形式把关键词数据转换成直观且有趣的图文模式。
pip安装:
pip install wordcloud
conda安装:
conda install -c conda-forge wordcloud
格式:
wordcloud = WordCloud(font_path,…)
参数解释:
| 属性 | 数据类型|默认值 | 解析 |
|---|---|---|
| font_path | string | 字体路径windows:C:/Windows/Fonts/Linux: /usr/share/fonts |
| width | int (default=400) | 输出的画布宽度,默认为400像素 |
| height | int (default=200) | 输出的画布高度,默认为200像素 |
| prefer_horizontal | float (default=0.90) | 词语水平方向排版出现的频率,默认 0.9 所以词语垂直方向排版出现频率为0.1 |
| mask | nd-array or None(default=None) | 如果参数为空,则使用二维遮罩绘制词云如果mask非空,设置的宽高值将被忽略遮罩形状被 mask 取代 |
| scale | float (default=1) | 按照比例进行放大画布,如设置为1.5,则长和宽都是原来画布的1.5倍 |
| min_font_size | int (default=4) | 显示的最小的字体大小 |
| font_step | int (default=1) | 字体步长,如果步长大于1,会加快运算但是可能导致结果出现较大的误差 |
| max_words | number (default=200) | 要显示的词的最大个数 |
| stopwords | set of strings or None | 设置需要屏蔽的词,如果为空,则使用内置的STOPWORDS |
| background_color | color value default=”black” | 背景颜色 |
| max_font_size | int or Nonedefault=None | 显示的最大的字体大小 |
| mode | string (default=”RGB”) | 当参数为“RGBA”并且background_color不为空时,背景为透明 |
| relative_scaling | float (default=.5) | 词频和字体大小的关联性 |
| color_func | callable, default=None | 生成新颜色的函数,如果为空,则使用 self.color_func |
| regexp | string or None (optional) | 使用正则表达式分隔输入的文本 |
| collocations | bool, default=True | 是否包括两个词的搭配 |
| colormap | string or matplotlib colormapdefault=”viridis” | 给每个单词随机分配颜色,若指定color_func,则忽略该方法 |
| random_state | int or None | 为每个单词返回一个PIL颜色 |
案列演示:

代码演示:
    from matplotlib import pyplot as plt
    from wordcloud import WordCloud

    with open('../something.txt',encoding='utf-8') as f:
        txt = f.read()
        # 调用WordCloud生成实例
        wordcloud = WordCloud(font_path='C:/Windows/Fonts/SIMLI.TTF',
        collocations=False,
        background_color='white',
        width=800,
        height=600,
        max_words=10).generate(txt)
        # font_path:字体路径,如果哦数据文件中包含有中文的话,font_path必须指定字体,否则会出现中文乱码
        # collocations:是否包括两个词的搭配,默认为True,为True时会有重复数据。
        # width:幕布的宽度
        # height:幕布的高度
        # max_words:显示词的最大个数
        # generate:读取文本文件

        # 生成图片
        image = wordcloud.to_image()
        # 展示图片
        image.show()
        # 写入文件
        wordcloud.to_file('tag.png')
如上图所示,wordclud默认是以空格作为分词。但很多时候我们的文本数据并不是单词,而是句子,因此我们需要将句子拆分开之后,才传给wordcloud,所以介绍下面一个库
中文使用词云图–需要使用分词模块jieba
“结巴”分词,中文分词组件,其特点:
- 支持四种分词模式:
- 精确模式,试图将句子最精确地切开,适合文本分析;
- 全模式,把句子中所有的可以成词的词语都扫描出来, 速度非常快,但是不能解决歧义;
- 搜索引擎模式,在精确模式的基础上,对长词再次切分,提高召回率,适合用于搜索引擎分词。
- paddle模式,利用PaddlePaddle深度学习框架,训练序列标注(双向GRU)网络模型实现分词。同时支持词性标注。paddle模式使用需安装paddlepaddle-tiny,pip install paddlepaddle-tiny==1.6.1。目前paddle模式支持jieba v0.40及以上版本。jieba v0.40以下版本,请升级jieba,pip install jieba --upgrade 。PaddlePaddle官网
- 支持繁体分词
- 支持自定义词典
更多介绍,请移步官网,
安装:
代码对 Python 2/3 均兼容
- 全自动安装:
easy_install jieba或者pip install jieba/pip3 install jieba - 半自动安装:先下载 http://pypi.python.org/pypi/jieba/ ,解压后运行
python setup.py install - 手动安装:将 jieba 目录放置于当前目录或者 site-packages 目录
- 通过
import jieba来引用 - 如果需要使用paddle模式下的分词和词性标注功能,请先安装paddlepaddle-tiny,
pip install paddlepaddle-tiny==1.6.1。
主要功能:
- 分词
jieba.cut方法接受四个输入参数: 需要分词的字符串;cut_all 参数用来控制是否采用全模式;HMM 参数用来控制是否使用 HMM 模型;use_paddle 参数用来控制是否使用paddle模式下的分词模式,paddle模式采用延迟加载方式,通过enable_paddle接口安装paddlepaddle-tiny,并且import相关代码;jieba.cut_for_search方法接受两个参数:需要分词的字符串;是否使用 HMM 模型。该方法适合用于搜索引擎构建倒排索引的分词,粒度比较细- 待分词的字符串可以是 unicode 或 UTF-8 字符串、GBK 字符串。注意:不建议直接输入 GBK 字符串,可能无法预料地错误解码成 UTF-8
jieba.cut以及jieba.cut_for_search返回的结构都是一个可迭代的 generator,可以使用 for 循环来获得分词后得到的每一个词语(unicode),或者用jieba.lcut以及jieba.lcut_for_search直接返回 listjieba.Tokenizer(dictionary=DEFAULT_DICT)新建自定义分词器,可用于同时使用不同词典。jieba.dt为默认分词器,所有全局分词相关函数都是该分词器的映射。
代码案列:
# encoding=utf-8
 import jieba

 seg_list = jieba.cut("我来到北京清华大学", cut_all=True)
 print("Full Mode: " + "/ ".join(seg_list))  # 全模式

 seg_list = jieba.cut("我来到北京清华大学", cut_all=False)
 print("Default Mode: " + "/ ".join(seg_list))  # 精确模式

 seg_list = jieba.cut("他来到了网易杭研大厦")  # 默认是精确模式
 print(", ".join(seg_list))

 seg_list = jieba.cut_for_search("小明硕士毕业于中国科学院计算所,后在日本京都大学深造")  # 搜索引擎模式
 print(", ".join(seg_list))
 # Full Mode: 我/ 来到/ 北京/ 清华/ 清华大学/ 华大/ 大学
 # Default Mode: 我/ 来到/ 北京/ 清华大学
 # 他, 来到, 了, 网易, 杭研, 大厦
 # 小明, 硕士, 毕业, 于, 中国, 科学, 学院, 科学院, 中国科学院, 计算, 计算所, ,, 后, 在, 日本, 京都, 大学, 日本京都大学, 深造
因为上面的分词出来有很多非核心词,例如介词’的’,'了’这种,因此需要使用jieba的另一个方法来提取关键词
-
jieba.analyse的关键词抽取
import jieba.analyse- jieba.analyse.extract_tags(sentence, topK=20, withWeight=False, allowPOS=())
- sentence is the text to be extracted
- topK is to return several keywords with the largest TF/IDF weight, the default value is 20
- withWeight is whether to return keyword weight value together, the default value is False
- allowPOS only includes words with the specified part of speech, the default value is empty, that is, no filtering, n-noun, a-adjective, v-verb
- jieba.analyse.TFIDF(idf_path=None) create a new TFIDF instance, idf_path is the IDF frequency file
- jieba.analyse.extract_tags(sentence, topK=20, withWeight=False, allowPOS=())
因此,词云图的最终版本:

代码:
    from matplotlib import pyplot as plt
    from wordcloud import WordCloud
    import jieba.analyse
    with open('../something.txt',encoding='utf-8') as f:
    txt = f.read()
    # 将文本拆分成单词
    word_list = jieba.analyse.extract_tags(txt,allowPOS='n')#默认精确模式
    # 将列表拼接成字符村
    word_str =' '.join(word_list)
    # 调用WordCloud生成实例
    wordcloud = WordCloud(font_path='C:/Windows/Fonts/SIMLI.TTF',
    collocations=False,
    background_color='white',
    width=800,
    height=600,
    max_words=50).generate(word_str)
    # font_path:字体路径,如果哦数据文件中包含有中文的话,font_path必须指定字体,否则会出现中文乱码
    # collocations:是否包括两个词的搭配,默认为True,为True时会有重复数据。
    # width:幕布的宽度
    # height:幕布的高度
    # max_words:显示词的最大个数
    # generate:读取文本文件

    # 生成图片
    image = wordcloud.to_image()
    # 展示图片
    image.show()
    # 写入文件
    wordcloud.to_file('tag1.png')
Category of website: technical article > Blog
Author:gfg
link:http://www.pythonblackhole.com/blog/article/375/6ff93b87de6d56579d98/
source:python black hole net
Please indicate the source for any form of reprinting. If any infringement is discovered, it will be held legally responsible.
name:
Comment content: (supports up to 255 characters)
no articles
