
全网最详细SIFT算法原理实现
posted on 2023-05-07 20:16 read(447) comment(0) like(18) collect(0)
Article Directory
1. SIFT Algorithm
1.1 What is SIFT algorithm?
Scale Invariant Feature Transform (SIFT, Scale Invariant Feature Transform) is a local feature description algorithm in the field of image processing. This method was proposed by Canadian professor David G.Lowe in 1999 and applied for a patent, which belongs to British Columbia University. The SIFT patent expired after March 17, 2020, and now you only need to update the cv version to use it for free.
The SIFT algorithm not only has scale invariance, but also can get better detection results when the image is rotated, the brightness of the image is changed, and the shooting position is moved.
In fact, in our life, the SIFT algorithm is still applied. For example, when we take a panoramic shot on our mobile phone, when we rotate the mobile phone to shoot, we can get a panoramic picture. Have you ever thought about it? The angle of view of the mobile phone camera Yes, why does the angle become larger when shooting through rotation? In fact, the angle has not changed, but we took a lot of images when we rotated the shooting, and these images have overlapping parts between them. Combine these images together, remove the overlapping parts, and you can get a panorama.
1.2 Features of SIFT algorithm
- It has good stability and no deformation , can be properly rotated, scaled, and changed in brightness, and can not be disturbed by viewing angle changes, affine transformations, and noise to a certain extent.
- Good discrimination , able to quickly and accurately distinguish information for matching in massive feature databases
- Multi-attribute , even if there is only a single object, it can generate a large number of feature vectors
- High speed , able to quickly perform feature vector matching
- Scalability , can be combined with other forms of feature vectors
2. The essence of SIFT algorithm
Find keypoints in different scale spaces, and calculate the orientation of keypoints.
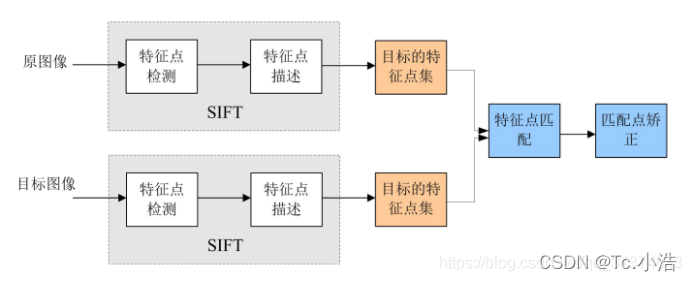
2.1 The SIFT algorithm implements feature matching mainly in the following three processes:
- Extract key points : Key points are some very prominent points that will not disappear due to factors such as lighting, scale, and rotation, such as corner points, edge points, bright spots in dark areas, and dark points in bright areas. This step is to search for image locations on all scale spaces. Potential scale- and rotation-invariant interest points are identified by a Gaussian differential function.
- Locate keypoints and determine feature orientation : At each candidate location, a well-fitted model is used to determine the location and scale. Keypoints are chosen according to their stability. Each keypoint location is then assigned one or more orientations based on the gradient orientation local to the image. All subsequent operations on the image data are transformed relative to the orientation, scale, and position of the keypoints, thereby providing invariance to these transformations.
- Through the feature vectors of each key point , a pairwise comparison is performed to find several pairs of feature points that match each other, and the corresponding relationship between scenes is established.
3. Principle of SIFT algorithm
3.1 Image Pyramid
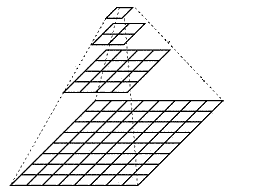
The image pyramid is a structure that interprets images with multiple resolutions, and generates N images with different resolutions by performing multi-scale pixel sampling on the original image. The image with the highest level of resolution is placed at the bottom, arranged in a pyramid shape, and a series of images with pixels (size) gradually decrease, until the top of the pyramid contains only one pixel image, which constitutes the traditional meaning Image pyramid on .
Obtaining an image pyramid generally includes two steps:
-
Smooth an image with a low-pass filter
-
Sampling (sampling) a smooth image
There are two sampling methods - upsampling (gradually increasing resolution) and downsampling (gradually reducing resolution)
Upsample:
Downsample:
3.2 Creating an Image Gaussian Pyramid
What is an Image Gaussian Pyramid?
Before talking about the Gaussian Pyramid, let’s talk about the human eye first. Our human eyes have two characteristics of the perception of the world: one is near, large and far small: the same object feels larger when viewed close up, and feels larger when viewed from a distance. Relatively small; the second is "fuzzy": more precisely, it should be "thickness". When we look close, we can see the details of the object (people will think it is clearer), such as a leaf, and we can see the texture of the leaf when we look closely. , only the outline of the film can be seen from a distance (people will feel blurred). From the perspective of frequency, the details of the image (such as texture, outline, etc.) represent the high-frequency components of the image, and the smoother areas of the image represent the image low-frequency components.
The image Gaussian pyramid is actually a kind of image scale space (divided into linear and nonlinear spaces, only linear space is discussed here). The concept of scale is used to simulate the distance between the observer and the object. While simulating the distance of the object, it also The thickness of the object has to be considered.
In summary, the scale space of the image is to simulate the distance and blur of the object seen by the human eye.
The image Gaussian pyramid takes these two aspects into consideration: ① the distance of the image; ② the blurring degree of the image (understood as thickness is better).
So how to simulate the distance of the image?
Sampling method (upsampling, downsampling)
For example, for an image, for each row, one pixel is taken every other pixel, then the final image is 1/2 of the row and column of the original image. This is a kind of downsampling.
So how to simulate the thickness of the image ?
The image is smoothed with a Gaussian kernel because the Gaussian convolution kernel is the only linear kernel that implements scale transformation.
Above, we understand the formation process of the Gaussian Pyramid from a perceptual point of view. Now let's rationally analyze the creation process of the Gaussian Pyramid.
The Gaussian pyramid is a concept proposed in the Sift operator. First of all, the Gaussian pyramid is not a pyramid, but consists of many groups (Octave) pyramids, and each group of pyramids contains several layers (Interval).
Gaussian pyramid construction process:
-
First double the original image and then use it as the first layer of the first group of Gaussian pyramids, and use the first group of first-layer images as the first group of pyramids after Gaussian convolution (in fact, Gaussian smoothing or Gaussian filtering). layer, the Gaussian convolution function is:
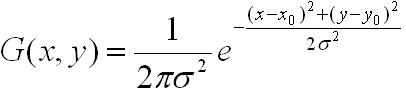
For the parameter σ, a fixed value of 1.6 is taken in the Sift operator. -
Multiply σ by a scale factor k, wait until a new smoothing factor σ=k*σ, use it to smooth the first group of layer 2 images, and the resulting image as the third layer.
-
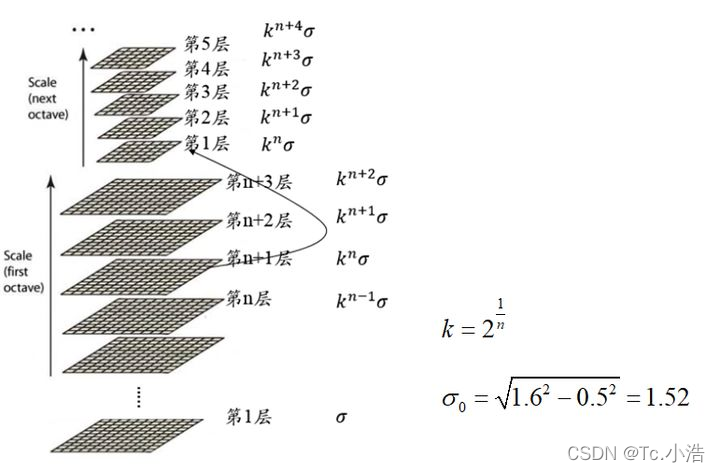
Repeat this way, and finally get L layers of images. In the same group, the size of each layer of images is the same, but the smoothing coefficient is different. Their corresponding smoothing coefficients are: 0, σ, kσ, k 2σ, k 3σ...k^(L-2)σ.
-
The third-to-last layer image of the first group is down-sampled with a scale factor of 2 , and the obtained image is used as the first layer of the second group, and then Gaussian smoothing with a smoothing factor of σ is performed on the first layer image of the second group to obtain The second layer of the second group, just like in step 2, obtains the L-layer images of the second group in this way, and their sizes in the same group are the same, and the corresponding smoothing coefficients are: 0, σ, kσ, k 2σ ,k 3σ...k^(L-2)σ. But group 2 is half the image of group 1 in terms of size.
Repeated execution in this way, you can get a total of O groups, each group of L layers, a total of O*L images, these images together form a Gaussian pyramid, the structure is as follows:
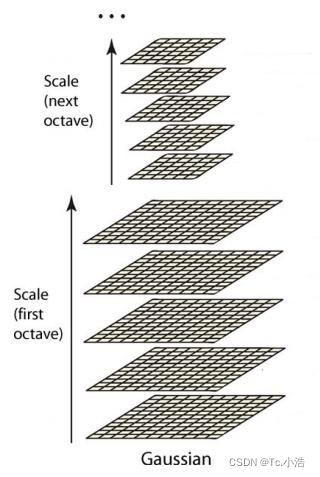
In the same group, the size of images in different layers is the same, and the Gaussian smoothing factor σ of the image in the latter layer is k times the smoothing factor of the image in the previous layer;
In different groups, the first image of the latter group is half the sample of the penultimate image of the previous group, and the size of the image is half of the previous group;
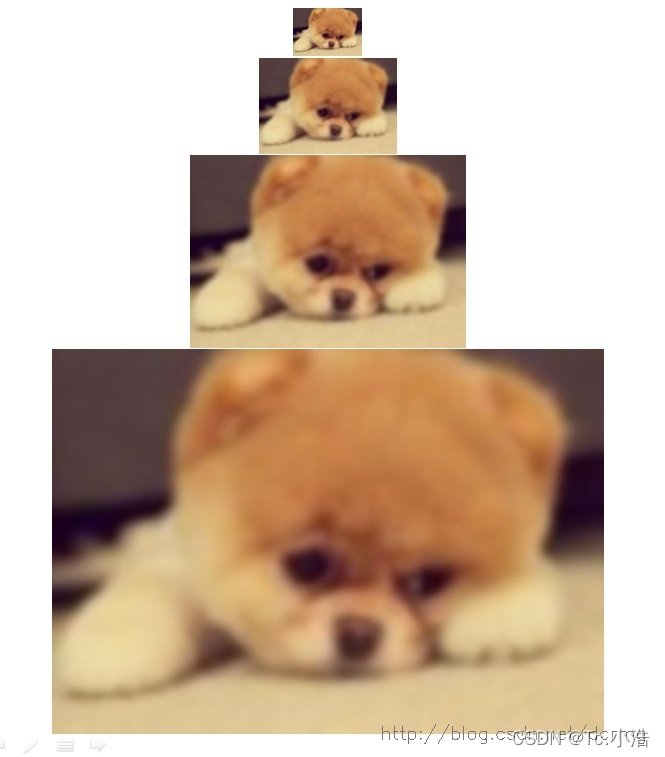
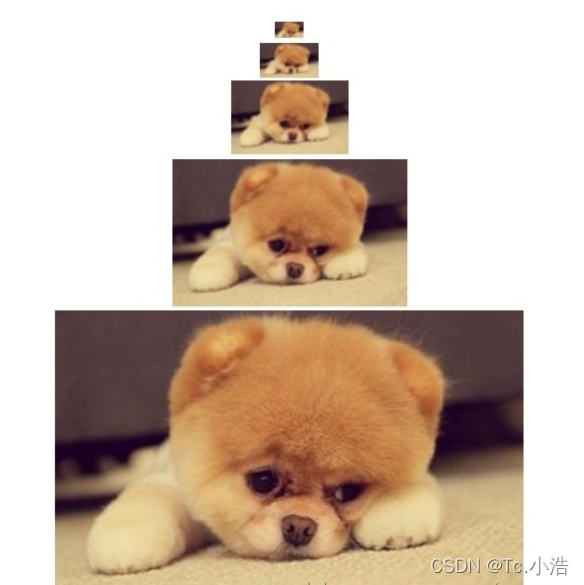
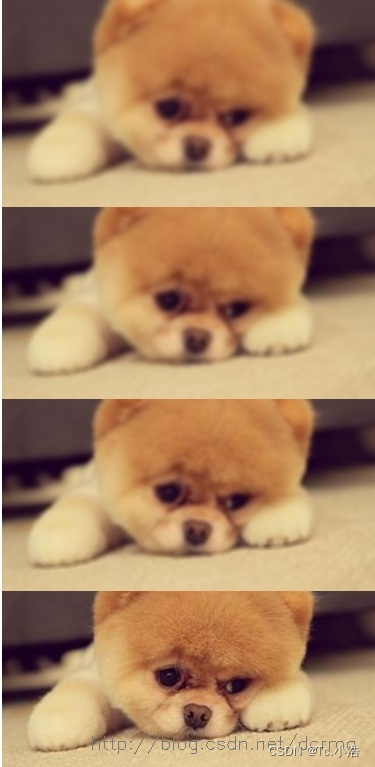
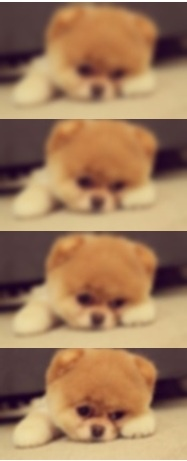
The effect of the Gaussian pyramid image is as follows, which are the 4 layers of the first group and the 4 layers of the second group:
3.3 Gaussian pyramid creation general picture
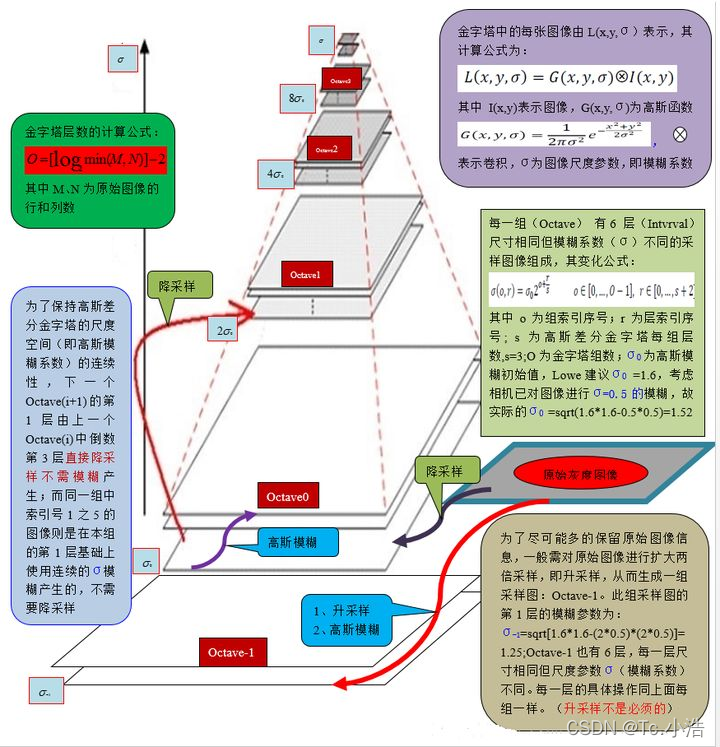
in

In formula (1), M is the row height of the original image; N is the column width of the original image; O is the group number of the Gaussian pyramid of the image.

In formula (2), n is the number of images to be extracted; S is the number of layers in each group of the image Gaussian pyramid.
注:n所代表的意思可能有人不太理解,这里详细说一下.
(1) 假设高斯金字塔每组有S = 5层,则高斯差分金字塔就有S-1 = 4,
那我们只能在高斯差分金字塔每组的中间2层图像求极值(边界是没有极值的),
所以n = 2

(2) 假设高斯金字塔每组有S = 6层,则高斯差分金字塔就有S-1 = 5,
那我们只能在高斯差分金字塔每组的中间3层图像求极值,所以n = 3

(3) 假设高斯金字塔每组有S = 7层,则高斯差分金字塔就有S-1 = 6,
那我们只能在高斯差分金字塔每组的中间4层图像求极值,所以n = 4
For the convenience of calculation, record the number of groups or layers starting from 0.

In (3), o is the group index number, r is the layer index number, and σ (o, r ) is the Gaussian blur coefficient of the corresponding image.
σ 0 σ_0
p0It is the initial value of Gaussian blur. Professor David G.Lowe first set it to 1.6. Considering that the camera has actually blurred the image with σ=0.5, it is actually:

through formula (3), the Gaussian blur coefficient in the corresponding image pyramid can be calculated ,as follows:
group 0, layer 0:

group 0, layer 1:

group 0, layer 2:

...
…
Group 1, Layer 0:

Group 1, Layer 1: Group

1, Layer 2:

...
Group 2, Layer 0:

Group 2, Layer 1: Group

2, Layer 2:

...
From the above calculations, we know that
① In each group, the Gaussian fuzzy system difference between adjacent layers
2 1 / n 2^{1/n}
21/n;
② The Gaussian blur coefficients of group 0, layer 0, group 1, layer 0, group 2, layer 0, ... are respectively
σ 0 , 2 σ 0 , 4 σ 0 , . . . σ_0,2σ_0,4σ_0,...
p0,2 p0,4 p0,. . .;
③ The 0th layer of the next group is obtained by down-sampling from the last 3rd layer of the previous group, without Gaussian blur operation.
The overall process, as shown in Figure 2:
4. Scale space
The scale space of the image solves the problem of how to describe the image at all scales.
在高斯金字塔中一共生成O组L层不同尺度的图像,这两个量合起来(O,L)就构成了高斯金字塔的尺度空间,也就是说以高斯金字塔的组O作为二维坐标系的一个坐标,不同层L作为另一个坐标,则给定的一组坐标(O,L)就可以唯一确定高斯金字塔中的一幅图像。
尺度空间的形象表述:
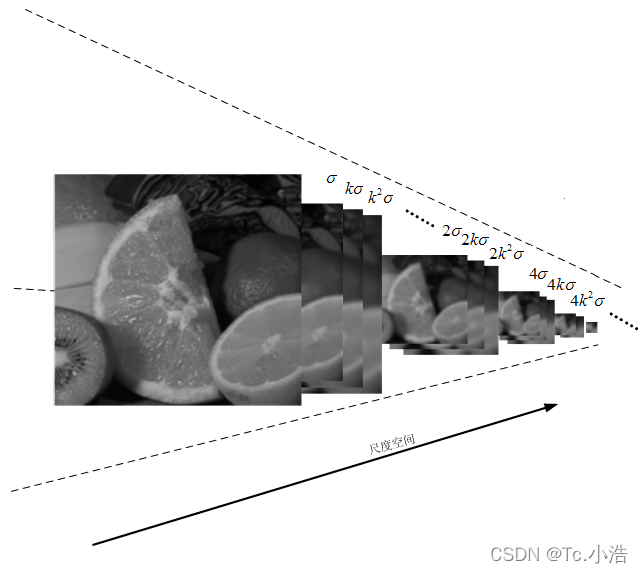
上图中尺度空间中k前的系数n表示的是第一组图像尺寸是当前组图像尺寸的n倍
五、高斯差分金字塔
创建好图像高斯金字塔后,每一组内的相邻层相减可以得到高斯差分金字塔(DoG, Difference of Gaussian),是后期检测图像极值点的前提,如图2所示:
DOG金字塔的第1组第1层是由高斯金字塔的第1组第2层减第1组第1层得到的。以此类推,逐组逐层生成每一个差分图像,所有差分图像构成差分金字塔。概括为DOG金字塔的第o组第l层图像是有高斯金字塔的第o组第l+1层减第o组第l层得到的。
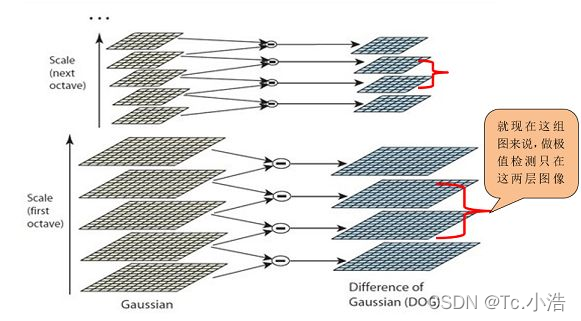
每一组在层数上,DOG金字塔比高斯金字塔少一层。后续Sift特征点的提取都是在DOG金字塔上进行的。
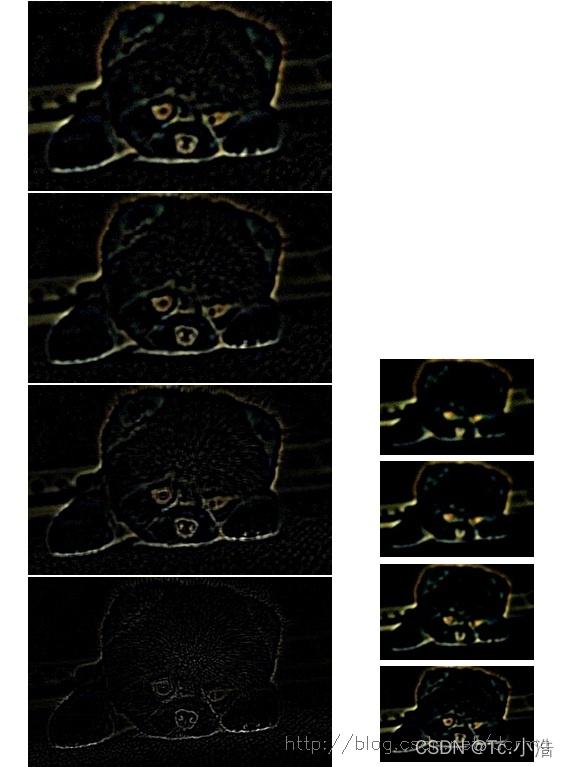
DOG金字塔的显示效果如下:
下边对这些DOG图像进行归一化,可有很明显的看到差分图像所蕴含的特征,并且有一些特征是在不同模糊程度、不同尺度下都存在的,这些特征正是Sift所要提取的“稳定”特征:
5.1极值点(Key points)的精确定位
阈值化

其中,T = 0.04,可人为设定其值;n为待提取特征的图像数;abs(val)为图像的像素值. 设定像素阈值,为了去除一些噪点或其它一些不稳定像素点.
在高斯差分金字塔中寻找极值点
特征点是由DOG空间的局部极值点组成的。为了寻找DoG函数的极值点,每一个像素点要和它所有的相邻点比较,看其是否比它的图像域和尺度域的相邻点大或者小。
如下图所示:在高斯差分金字塔中寻找极值点,除了考虑x,y方向的点,还要考虑σ 方向的点,所以判断一个像素点是否为极值点,要与周围的26个点进行比较.
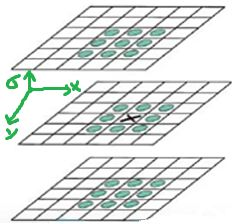
注:
① 如果高斯差分金字塔每组有3层,则只能在中间1层图像寻 找极值点,
两端的图像不连续,没有极值点.
② 如果高斯差分金字塔每组有5层,则只能在中间3层图像寻找极值点.
依此类推…
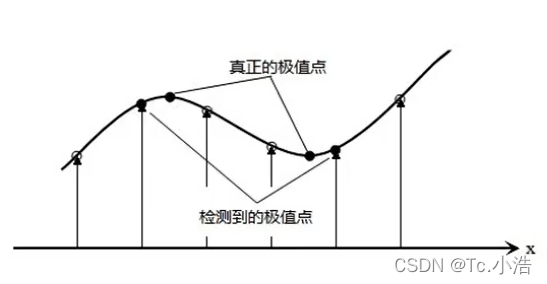
当我们检测到极值点之后,会发现一个问题,高斯差分金字塔是离散的(因为尺度空间和像素点都是离散的),所以找到的极值点不太准确的,很大可能在真正极值点附近,如图4所示,为了找到更高亚像素位置精度的极值点,需利用泰勒展开式.
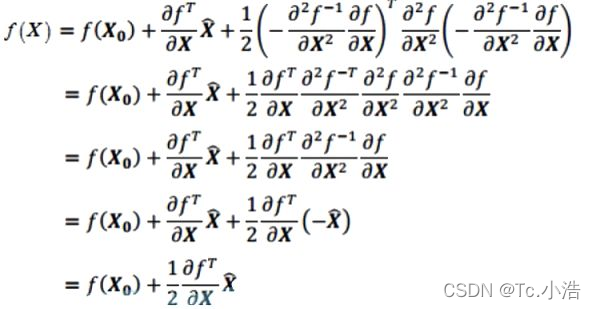
更正极值点位置
在检测到的极值点处,作三元二阶泰勒展开:
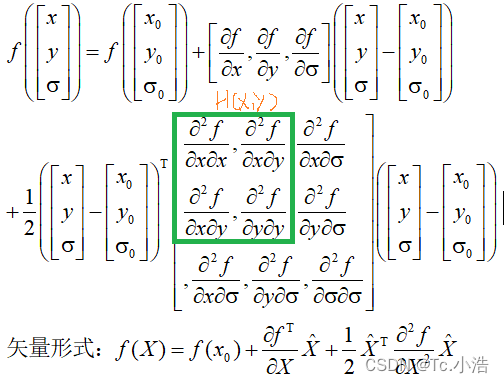
f(x)对x进行求导:

令导数为零

带入f(x),可得
注:
上述求解的结束标志:达到一定的迭代次数.
求解亚像素精度极值点时,当所得解超出离散极值点一定范围舍去,
因为泰勒展开只是在离散点附近能够较好的拟合原函数.
舍去低对比度的点
若|f(x)|<T/n,则舍去点X
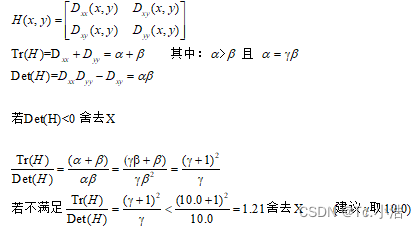
去除边缘效应
本质上要去掉DoG局部曲率非常不对称的像素. 一个定义不好的高斯差分算子的极值在横跨边缘的地方有较大的主曲率,而在垂直边缘的方向有较小的主曲率。主曲率通过一个2×2的海森矩阵(Hessian Matrix)H求出,D的主曲率和H的特征值成正比,令α 为较大特征值,β 为较小的特征值.
注:最终得到像素点坐标(x,y)可以不是整数,σ可以不是在高斯金字塔的某一层上.
5.2确定关键点(极值点)方向
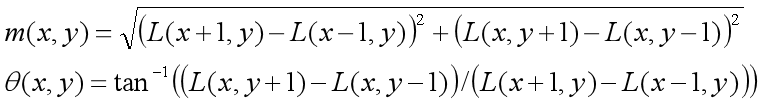
1、通过尺度不变性求极值点,需要利用图像的局部特征为给每一个关键点分配一个基准方向,使描述子对图像旋转具有不变性。对于在DOG金字塔中检测出的关键点,采集其所在高斯金字塔图像3σ邻域窗口内像素的梯度和方向分布特征。梯度的模值和方向如下:
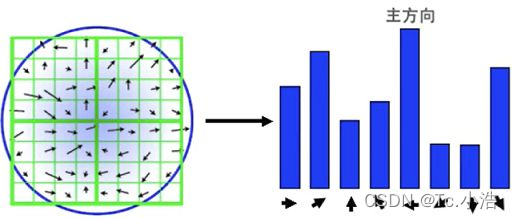
2、本算法采用梯度直方图统计法,统计以关键点为原点,一定区域内的图像像素点确定关键点方向。在完成关键点的梯度计算后,使用直方图统计邻域内像素的梯度和方向。梯度直方图将0~360度的方向范围分为36个柱,其中每柱10度。如下图所示,直方图的峰值方向代表了关键点的主方向,方向直方图的峰值则代表了该特征点处邻域梯度的方向,以直方图中最大值作为该关键点的主方向。为了增强匹配的鲁棒性,只保留峰值大于主方向峰值80%的方向作为该关键点的辅方向。
统计以特征点为圆心,以该特征点所在的高斯图像的尺度的1.5倍为半径的圆内的所有的像素的梯度方向及其梯度幅值,并做1.5σ的高斯滤波(高斯加权,离圆心也就是关键点近的幅值所占权重较高).
5.3关键点描述
上述过程,只是找到关键点并确定了其方向,但SIFT算法核心用途在于图像的匹配,我们需要对关键点进行数学层面的特征描述,也就是构建关键点描述符.
1、确定计算描述子所需的图像区域
描述子梯度方向直方图由关键点所在尺度的高斯图像计算产生. 图像区域的半径通过下式(17)计算:

d=4,代表划分4x4个子块
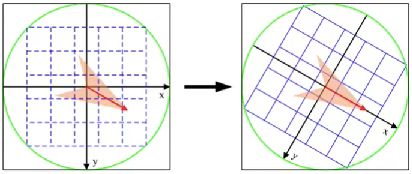
2、将坐标移到关键点方向
关键点所在的半径区域,移至关键点方向,如下图所示
3、生成关键点描述符
将区域划分为4x4的子块,对每一个子块进行8个方向的直方图统计操作,获得每个方向的梯度幅值,总共可以组成128维描述向量。
对于每一个关键点,都拥有位置、尺度以及方向三个信息。为每个关键点建立一个描述符,用一组向量将这个关键点描述出来,使其不随各种变化而改变,比如光照变化、视角变化等等。这个描述子不但包括关键点,也包含关键点周围对其有贡献的像素点,并且描述符应该有较高的独特性,以便于提高特征点正确匹配的概率。
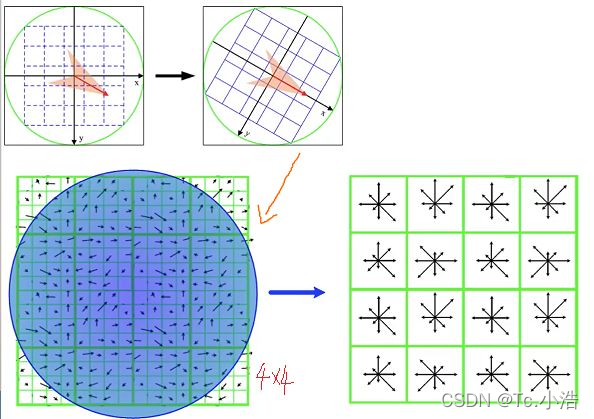
实验表明:描述子采用4x4x8=128维向量表示,效果最优
5.4关键点匹配
1、分别对模板图(参考图,reference image)和实时图(观测图,observation image)建立关键点描述子集合。目标的识别是通过两点集内关键点描述子的比对来完成。具有128维的关键点描述子的相似性度量采用欧式距离。
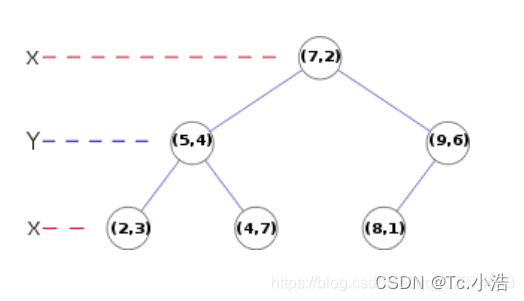
2、匹配可采取穷举法完成,但所花费的时间太多。所以一般采用kd树的数据结构来完成搜索。搜索的内容是以目标图像的关键点为基准,搜索与目标图像的特征点最邻近的原图像特征点和次邻近的原图像特征点。
Kd树如下如所示,是个平衡二叉树
六、sift代码
import cv2
import numpy as np
import matplotlib.pyplot as plt
#1、读取图像
img=cv2.imread('cat.jpg')
cat=cv2.cvtColor(img,cv2.COLOR_BGR2GRAY)
#2、sift关键点检测
#sift实例化对象
sift=cv2.xfeatures2d.SIFT_create()
# 2.2关键点检测:kp关键点信息包括方向,尺度,位置信息,des是关键点的描述符
kp,des=sift.detectAndCompute(cat,None)
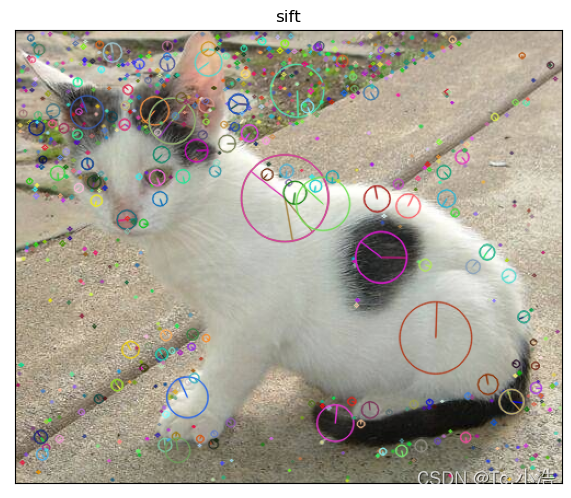
# 2.3在图像上绘制关键点的检测结果
cv2.drawKeypoints(img,kp,img,flags=cv2.DRAW_MATCHES_FLAGS_DRAW_RICH_KEYPOINTS)
#3图像显示
plt.figure(figsize=(8,6),dpi=100)
plt.imshow(img[:,:,::-1]),plt.title('sift')
plt.xticks([]),plt.yticks([])
plt.show()

七、总结
SIFT特征具有稳定性和不变性,在图像处理和计算机视觉领域有着很重要的作用,其本身也是非常复杂的,由于接触SIFT不是很久,对其中的相关知识了解还很不足,经多方查阅参考,写得此文,内容还不够详尽,望多多见谅。以下是SIFT算法的粗略总结。
1、DoG尺度空间的极值检测。
2、删除不稳定的极值点。
3、确定特征点的主方向
4、生成特征点的描述子进行关键点匹配。
Reference article
https://blog.csdn.net/qq_37374643/article/details/88606351
https://zhuanlan.zhihu.com/p/343522892?ivk_sa=1024320u
Category of website: technical article > Blog
Author:Ineverleft
link:http://www.pythonblackhole.com/blog/article/367/607a981974ca13934cb0/
source:python black hole net
Please indicate the source for any form of reprinting. If any infringement is discovered, it will be held legally responsible.
name:
Comment content: (supports up to 255 characters)
no articles