Use python to read and save as excel, csv, txt files and basic operations on DataFrame files
posted on 2023-05-07 20:46 read(111) comment(0) like(15) collect(1)
Article Directory
1. Processing of excel files
1. Read the excel file and convert its content into DataFrame and matrix form
① Convert excel to dataframe format
data_file = 'Pre_results.xlsx' # Excel文件存储位置
D = pd.read_excel('Pre_results.xlsx')
print(D)
② Convert excel to matrix format
The first thing to explain is that all elements in the same matrix must be of the same type .
For example, when generating a matrix, we can specify the type dtype=str, int, float, etc. for the matrix.
# 生成一个2×2的类型为str的矩阵
import numpy as np
datamatrix = np.zeros((2, 2),dtype = str)
print(datamatrix)

It can be seen that the elements in this matrix are all str type.
Code combat:
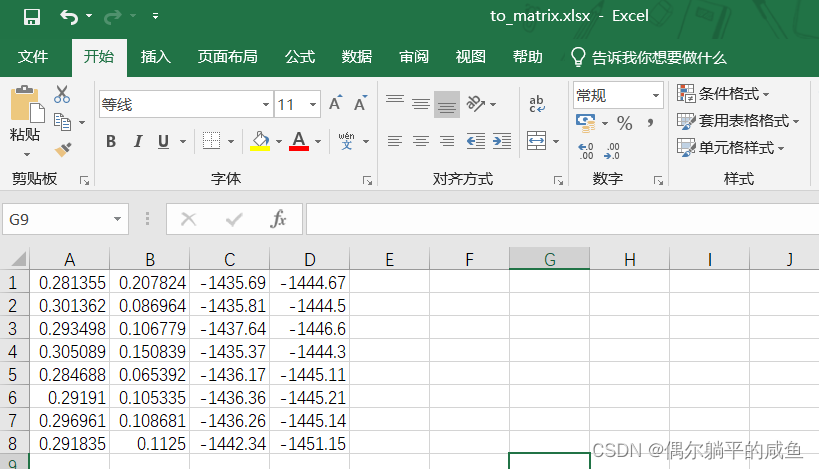
first look at the content of the excel file we are going to deal with.
The code is directly below.
import numpy as np
import xlrd
def import_excel_matrix(path):
    table = xlrd.open_workbook(path).sheets()[0] # 获取第一个sheet表
    row = table.nrows # 行数
    #print(row)
    col = table.ncols # 列数
    datamatrix = np.zeros((row, col),dtype = float) # 生成一个nrows行*ncols列的初始矩阵,在excel中,类型必须相同,否则需要自己指定dtype来强制转换。
    for i in range(col): # 对列进行遍历 向矩阵中放入数据
        #print(table.col_values(i)) #是矩阵
        cols = np.matrix(table.col_values(i)) # 把list转换为矩阵进行矩阵操作
        #print(cols)
        #cols = float(cols)
        datamatrix[:, i] = cols # 按列把数据存进矩阵中
    return datamatrix
data_file = 'to_matrix.xlsx' # Excel文件存储位置
data_matrix = import_excel_matrix(data_file)
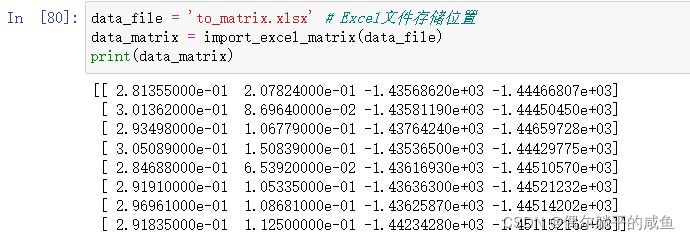
print(data_matrix)
operation result:

2. Write data to xlsx file
# 1.导入openpyxl模块
import openpyxl
# 2.调用Workbook()方法
wb = openpyxl.Workbook()
# 3. 新建一个excel文件,并且在单元表为"sheet1"的表中写入数据
ws = wb.create_sheet("sheet1")
# 4.在单元格中写入数据
# ws.cell(row=m, column=n).value = *** 在第m行n列写入***数据
ws.cell(row=1, column=1).value = "时间"
ws.cell(row=1, column=2).value = "零食"
ws.cell(row=1, column=3).value = "是否好吃"
# 5.保存表格
wb.save('嘿嘿.xlsx')
print('保存成功!')
3. Save the data as an xlsx file
import xlwt
workbook=xlwt.Workbook(encoding='utf-8')
booksheet=workbook.add_sheet('Sheet 1', cell_overwrite_ok=True)
DATA=(('学号','姓名','年龄','性别','成绩'),
('1001','A','11','男','12'),
('1002','B','12','女','22'),
('1003','C','13','女','32'),
('1004','D','14','男','52'),)
for i,row in enumerate(DATA):
    for j,col in enumerate(row):
        booksheet.write(i,j,col)
workbook.save('grade.xls')
4. Disadvantages of using excel to process data
It can only be read and written line by line, and the matrix form can only store the same type of data, which is not efficient.
Second, the processing of csv files
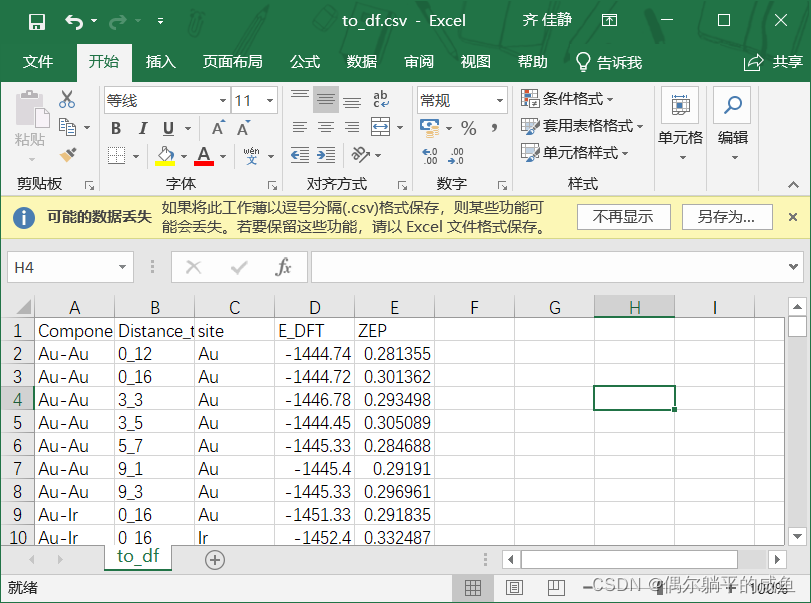
1. Read the csv file and convert its content into DataFrame form

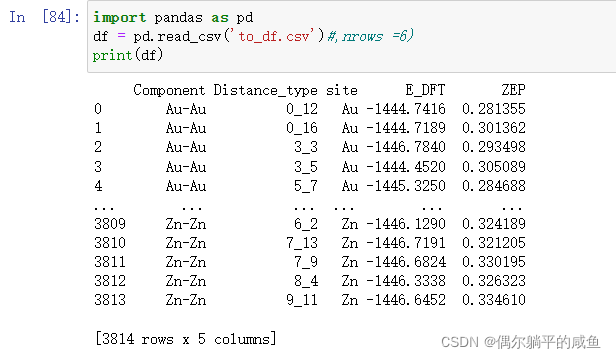
import pandas as pd
df = pd.read_csv('to_df.csv') #,nrows =6) nrows=6表示只读取前六行数据
print(df)

2. Save the DataFrame as a csv file
df.to_csv('df_to_csv.csv')
3. Advantages and disadvantages
①CSV is a plain text file, but excel is not plain text, and excel contains a lot of format information in it.
②CSV files will be smaller in size, more convenient to create, distribute and read, and suitable for storing structured information, such as record export, traffic statistics, etc.
③The default opening method of CSV files on the windows platform is excel, but its essence is a text file.
④The csv file has only one sheet, too many sheets are not easy to save, pay attention to the naming convention.
3. Processing of txt files
1. Read the txt file
f=open('data.txt')
print(f.read())
2. Write data to txt file
Note that DataFrame cannot be written to txt files, only strings.
f = open('data.txt','w', encoding='utf-8') #打开文件,若文件不存在系统自动创建
#w只能写入操作 r只能读取 a向文件追加;w+可读可写 r+可读可写 a+可读可追加;wb+写入进制数据
#w模式打开文件,如果文件中有数据,再次写入内容,会把原来的覆盖掉
f.write('hello world! = %.3f' % data) #write写入
f.writelines(['hello!\n']) #writelines 将列表中的字符串写入文件 但不会换行 参数必须是一个只存放字符串的列表
f.close() #关闭文件
3. Save the data to a txt file
save_path= 'save.txt'
np.savetxt(save_path, data, fmt='%.6f')
4. Basic operations on DataFrame files
1. DataFrame creation
①DataFrame是一种表格型数据结构,(每一列的数据类型可以不同,而矩阵必须相同)它含有一组有序的列,每列可以是不同的值。
②DataFrame既有行索引,也有列索引,(调用其值时用)它可以看作是由Series组成的字典,不过这些Series公用一个索引。
③DataFrame的创建有多种方式,可以根据dict进行创建,也可以读取csv或者txt文件来创建。这里主要介绍这两种方式。
1.1根据字典创建
data = {
    'state':['Ohio','Ohio','Ohio','Nevada','Nevada'],
    'year':[2000,2001,2002,2001,2002],
    'pop':[1.5,1.7,3.6,2.4,2.9]
}
frame = pd.DataFrame(data)
frame

#输出
    pop state   year
0   1.5 Ohio    2000
1   1.7 Ohio    2001
2   3.6 Ohio    2002
3   2.4 Nevada  2001
4   2.9 Nevada  2002
DataFrame的行索引是index,列索引是columns,我们可以在创建DataFrame时指定索引的值:
frame2 = pd.DataFrame(data,index=['one','two','three','four','five'],columns=['year','state','pop','debt'])
frame2

#输出
    year    state   pop debt
one 2000    Ohio    1.5 NaN
two 2001    Ohio    1.7 NaN
three   2002    Ohio    3.6 NaN
four    2001    Nevada  2.4 NaN
five    2002    Nevada  2.9 NaN
使用嵌套字典也可以创建DataFrame,此时外层字典的键作为列,内层键则作为索引:
pop = {'Nevada':{2001:2.4,2002:2.9},'Ohio':{2000:1.5,2001:1.7,2002:3.6}}
frame3 = pd.DataFrame(pop)
frame3
#输出
    Nevada  Ohio
2000    NaN 1.5
2001    2.4 1.7
2002    2.9 3.6
我们可以用index,columns,values来访问DataFrame的行索引,列索引以及数据值,数据值返回的是一个二维的ndarray
frame2.values
frame2.values[0,1]
1.2读取文件
读取文件生成DataFrame最常用的是read_csv,read_table方法。该方法中几个重要的参数如下所示:

其他创建DataFrame的方式有很多,比如我们可以通过读取mysql或者mongoDB来生成,也可以读取json文件等等,这里就不再介绍。
1.3 DataFrame文件拼接
df = df1.append([df2,df3], ignore_index = True)
2.DataFrame轴的概念
在DataFrame的处理中经常会遇到轴的概念,这里先给大家一个直观的印象,我们所说的axis=0即表示沿着每一列或行标签\索引值向下执行方法,axis=1即表示沿着每一行或者列标签模向执行对应的方法。
3.DataFrame一些性质
3.1索引、切片
我们可以根据列名来选取一列,返回一个Series:
frame2['year'] #索引列名
索引多列
data = pd.DataFrame(np.arange(16).reshape((4,4)),index = ['Ohio','Colorado','Utah','New York'],columns=['one','two','three','four'])
data[['two','three']]
索引多行
data[:2] #第一行和第二行
#输出
    one two three   four
Ohio    0   1   2   3
Colorado    4   5   6   7
索引时,如果要是用标签,最好使用loc方法,如果使用下标,最好使用iloc方法。
data.loc['Colorado',['two','three']]
#输出
two      5
three    6
Name: Colorado, dtype: int64

data.iloc[0:3,2]
#输出
Ohio         2
Colorado     6
Utah        10
Name: three, dtype: int64
3.2修改数据
可以使用一个标量修改DataFrame中的某一列,此时这个标量会广播到DataFrame的每一行上。
data = {
    'state':['Ohio','Ohio','Ohio','Nevada','Nevada'],
    'year':[2000,2001,2002,2001,2002],
    'pop':[1.5,1.7,3.6,2.4,2.9]
}
frame2 = pd.DataFrame(data,index=['one','two','three','four','five'],columns=['year','state','pop','debt'])
frame2
frame2['debt']=16.5
也可以使用一个列表来修改,不过要保证列表的长度与DataFrame长度相同:
frame2.debt = np.arange(5)
可以使用一个Series,此时会根据索引进行精确匹配:
val = pd.Series([-1.2,-1.5,-1.7],index=['two','four','five'])
frame2['debt'] = val
3.3算数运算
DataFrame在进行算术运算时会进行补齐,在不重叠的部分补足NA
df1 = pd.DataFrame(np.arange(9).reshape((3,3)),columns=list('bcd'),index=['Ohio','Texas','Colorado'])
df2 = pd.DataFrame(np.arange(12).reshape((4,3)),columns = list('bde'),index=['Utah','Ohio','Texas','Oregon'])
df1 + df2
3.4函数应用和映射
numpy的元素级数组方法,也可以用于操作Pandas对象:
frame = pd.DataFrame(np.random.randn(3,3),columns=list('bcd'),index=['Ohio','Texas','Colorado'])
np.abs(frame)
另一个常见的操作是,将函数应用到由各列或行所形成的一维数组上。DataFrame的apply方法即可实现此功能。
f = lambda x:x.max() - x.min()
frame.apply(f)
3.5排序和排名
对于DataFrame,sort_index可以根据任意轴的索引进行排序,并指定升序降序
frame = pd.DataFrame(np.arange(8).reshape((2,4)),index=['three','one'],columns=['d','a','b','c'])
frame.sort_index()
DataFrame也可以按照值进行排序:
#按照任意一列或多列进行排序
frame.sort_values(by=['a','b'])
3.6汇总和计算描述统计
DataFrame中的实现了sum、mean、max等方法,我们可以指定进行汇总统计的轴,同时,也可以使用describe函数查看基本所有的统计项:
df = pd.DataFrame([[1.4,np.nan],[7.1,-4.5],[np.nan,np.nan],[0.75,-1.3]],index=['a','b','c','d'],columns=['one','two'])
df.sum(axis=1)
#输出
one    9.25
two   -5.80
dtype: float64

#Na会被自动排除,可以使用skipna选项来禁用该功能
df.mean(axis=1,skipna=False)
#输出
a      NaN
b    1.300
c      NaN
d   -0.275
dtype: float64
#idxmax返回间接统计,是达到最大值的索引

df.idxmax()
#输出
one    b
two    d
dtype: object

#describe返回的是DataFrame的汇总统计
#非数值型的与数值型的统计返回结果不同
df.describe()
DataFrame也实现了corr和cov方法来计算一个DataFrame的相关系数矩阵和协方差矩阵,同时DataFrame也可以与Series求解相关系数。
frame1 = pd.DataFrame(np.random.randn(3,3),index=list('abc'),columns=list('abc'))
frame1.corr
frame1.cov()
#corrwith用于计算每一列与Series的相关系数
frame1.corrwith(frame1['a'])
3.7处理缺失数据
There are three main methods related to missing values in Pandas:
the isnull method is used to determine whether the data is empty data;
the fillna method is used to fill missing data;
the dropna method is used to discard missing data.
The above two methods return a new Series or DataFrame, which has no effect on the original data. If you want to directly modify the original data, use the inplace parameter:
data = pd.DataFrame([[1,6.5,3],[1,np.nan,np.nan],[np.nan,np.nan,np.nan],[np.nan,6.5,3]])
data.dropna()
#输出
    0   1   2
0   1.0 6.5 3.0
For DataFrame, if the dropna method finds missing values, it will delete the entire row, but you can specify the deletion method, how=all, it will be deleted when the entire row is all na, and you can also specify the axis to delete .
data.dropna(how='all',axis=1,inplace=True)
data
#输出
0   1   2
0   1.0 6.5 3.0
1   1.0 NaN NaN
2   NaN NaN NaN
3   NaN 6.5 3.0
DataFrame filling missing values can be filled uniformly, or by column, or specify a filling method:
data.fillna({1:2,2:3})
#输出
0   1   2
0   1.0 6.5 3.0
1   1.0 2.0 3.0
2   NaN 2.0 3.0
3   NaN 6.5 3.0

data.fillna(method='ffill')
#输出
0   1   2
0   1.0 6.5 3.0
1   1.0 6.5 3.0
2   1.0 6.5 3.0
3   1.0 6.5 3.0
3.8 Others
a = df.groupby(['device_category', 'media_category'])['exposure_last'].mean()
Select the rows with the same two features 'device_category', 'media_category', and calculate the mean value (sum summation) according to 'exposure_last'.
What is Series in Dataframe?
1. The difference between series and array types is that series has indexes, while the other does not; the data in series must be one-dimensional, but the type of array is not necessarily 2. Series can be regarded as
a fixed-length ordered dictionary, The properties of series can be obtained through shape, index, values, etc.
Operations on other files
file copy operation
import shutil
shutil.copyfile(dir1,dir2)
If the path does not exist create the path
if not os.path.exists(datapath):
	os.mkdir(datapath)
View the contents of the current directory
import os
all_files = os.listdir(os.getcwd())
print(all_files)
filenames = os.listdir(os.curdir)  #获取当前目录中的内容
print(filenames)
Category of website: technical article > Blog
Author:gfg
link:http://www.pythonblackhole.com/blog/article/341/1f302c718ae76ab00942/
source:python black hole net
Please indicate the source for any form of reprinting. If any infringement is discovered, it will be held legally responsible.
name:
Comment content: (supports up to 255 characters)
no articles