How python realizes point cloud visualization interaction - Open3D example tutorial (obtaining information of selected points) nanny level teaching
posted on 2023-05-07 19:34 read(521) comment(0) like(25) collect(5)
foreword
Open3D is a modern library for 3D data processing currently available in python. It can read, sample, register, and visualize 3D data such as point clouds and grids. Among them, the function of visualizing 3D models such as point clouds is very convenient in Python.
After researching the official documents, the author found that there are commands to return the information of the selected point in the various visualization functions of Open3D. After running the code, there will be this article on the visualization and interaction of 3D objects. I hope you can pass it. This article gets some new ideas.
Development environment
python 3.9.12
Open3D 0.15.1
Pycharm 2021.2
Visualization of point clouds
Open3D can use two ways to visualize the point cloud. One is to use the function draw_geometries for drawing the geometric figure list directly under visualization to display, and the other is to use the visualization tool Visualizer to display.
The first method is simple and fast, but it cannot return the information of the selected point. If readers find a method that can return values, welcome to add.
1. draw_geometries
Four different draw_geometries are given in the official documentation of Open3D
- draw_geometries - function for drawing lists of geometries
- draw_geometries_with_editing – function for drawing a list of geometries with editing capabilities
- draw_geometries_with_key_callbacks - function to draw a list of geometries with key callbacks
- draw_geometries_with_vertex_selection – function to draw a list of geometries with vertex selection
Except for the first function, the latter three can select points and display the information of the selected points in the terminal, but they do not return a value, so we cannot directly get the information of the selected points in the program.
The visualization effects of the latter three selected points are also different, and here we only explain the fourth one.
The code of draw_geometries is relatively simple, and it is more convenient for normal use. If you are interested, you can try to run the official routine:
The first draw_geometries
import open3d as o3d
import numpy as np
print("Load a ply point cloud, print it, and render it")
ply_point_cloud = o3d.data.PLYPointCloud()
pcd = o3d.io.read_point_cloud(ply_point_cloud.path)
print(pcd)
print(np.asarray(pcd.points))
o3d.visualization.draw_geometries([pcd],
                                  zoom=0.3412,
                                  front=[0.4257, -0.2125, -0.8795],
                                  lookat=[2.6172, 2.0475, 1.532],
                                  up=[-0.0694, -0.9768, 0.2024])
Tip: Press the H key after the visualization window pops up to view the detailed operation menu in the terminal
The fourth draw_geometries_with_vertex_selection
import open3d as o3d
import numpy as np
print("Load a ply point cloud, print it, and render it")
ply_point_cloud = o3d.data.PLYPointCloud()
pcd = o3d.io.read_point_cloud(ply_point_cloud.path)
print(pcd)
print(np.asarray(pcd.points))
point = o3d.visualization.draw_geometries_with_key_callbacks([pcd])
print(point)
Execute the code, and the visualization window jumps out
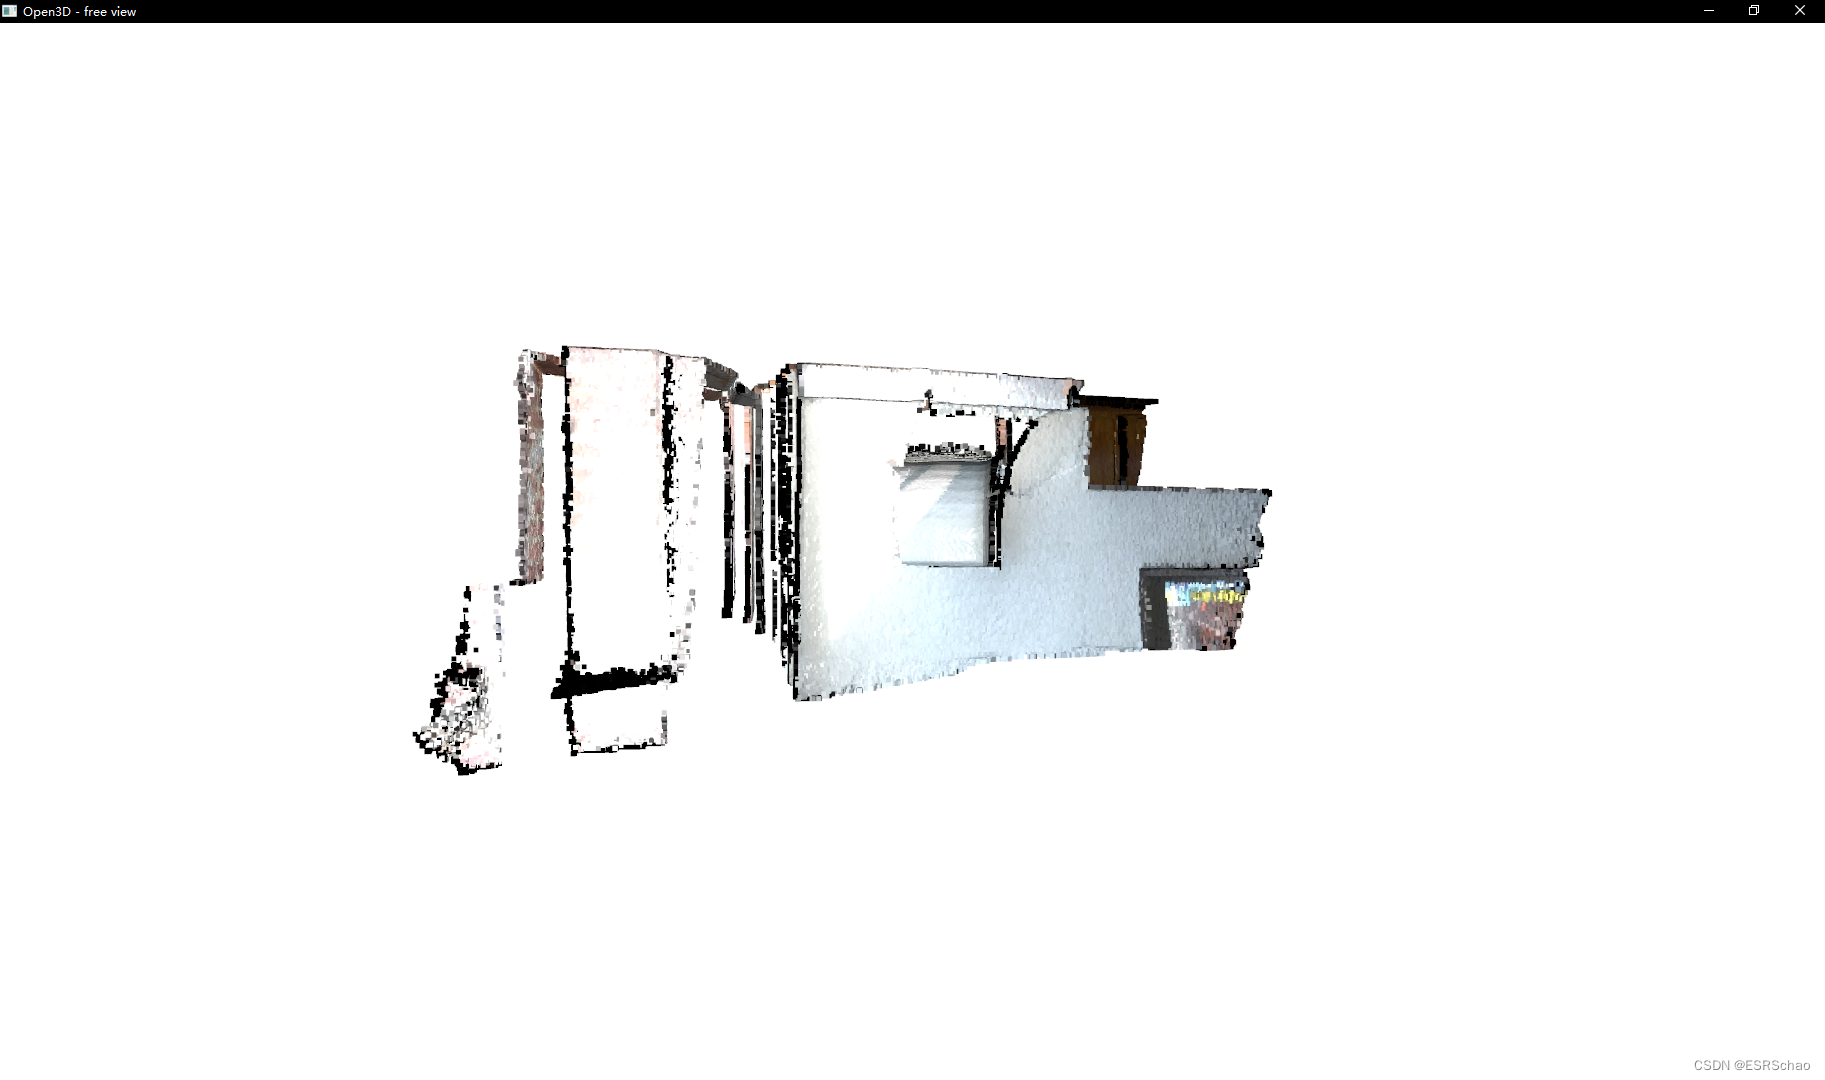
At this time, press the Shift key in the visualization window to enter the selection mode of the point:
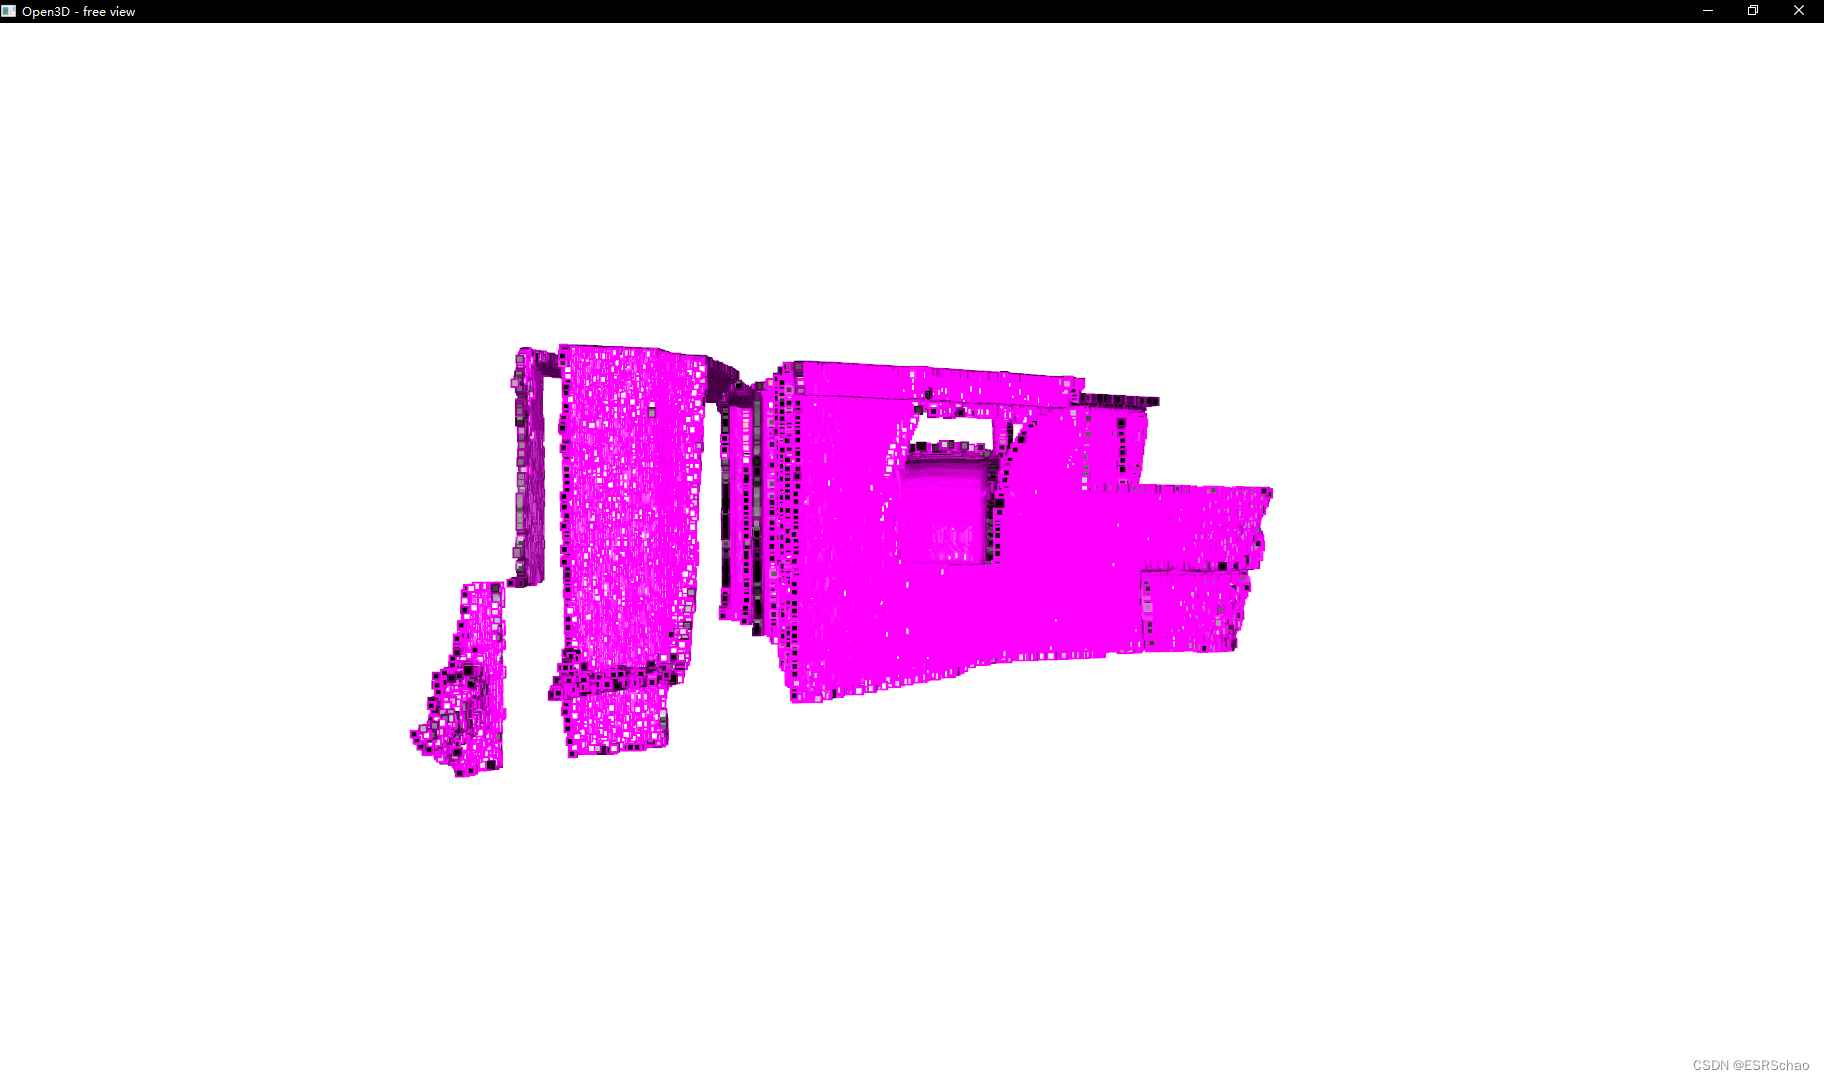
At this time, use the mouse to select vertices, and the information of the selected points will be displayed in the terminal:
Note: point is used in the code to obtain the return value information, and the final printed point is None to prove that the selected point will only be displayed in the terminal and will not return a value
The official documentation also states that the function has no return value, so what should I do if I want to get the information of the selected point. This is another method that can be used.
2.Visualizer
Four different Visualizers are also given in the official documentation of Open3D
- Visualizer —— Visualizer main class
- VisualizerWithEditing - a visualizer with editing capabilities
- VisualizerWithKeyCallback - Visualizer with custom key call functionality
- VisualizerWithVertexSelection - Visualizer with Vertex Selection
For a visualization tool such as open3d.visualization.Visualizer, its basic usage can be briefly summarized as the following steps (the author simplifies the parameters of each function for demonstration, and interested readers can refer to the official documentation ):
- Create vis class
vis = o3d.visualization.VisualizerWithVertexSelection() - Create a visual window
vis.create_window(window_name='Open3D', width=1920, height=1080, visible=True) - Input point cloud or grid data
vis.add_geometry(mesh) - Activate the window This operation will block the thread
vis.run() - Clear the visualization window
vis.destroy_window()
In the visualization process, operations such as obtaining the RGB image and depth map of the current viewing angle can also be performed through related functions, which is very convenient.
And open3d.visualization.VisualizerWithVertexSelection adds a function get_picked_points:
get_picked_points(self: open3d.cpu.pybind.visualization.VisualizerWithVertexSelection) → List[open3d::visualization::VisualizerWithVertexSelection::PickedPoint]
Its description is Function to get picked points, this function can return the coordinates and index information of the points selected in the visualization window.
The figure below shows the information of the return value point. You can see that the point list has the coord three-dimensional position information and index information of point 0 when a point is selected.

The overall procedure is as follows, using my own point cloud model:
import open3d as o3d
import numpy as np
pcd = o3d.io.read_point_cloud("arrow.ply")
vis = o3d.visualization.VisualizerWithVertexSelection()
vis.create_window(window_name='Open3D', visible=True)
vis.add_geometry(pcd)
vis.run()
point = vis.get_picked_points()
vis.destroy_window()
print(point[0].index, np.asarray(point[0].coord))
pop-up visual interface
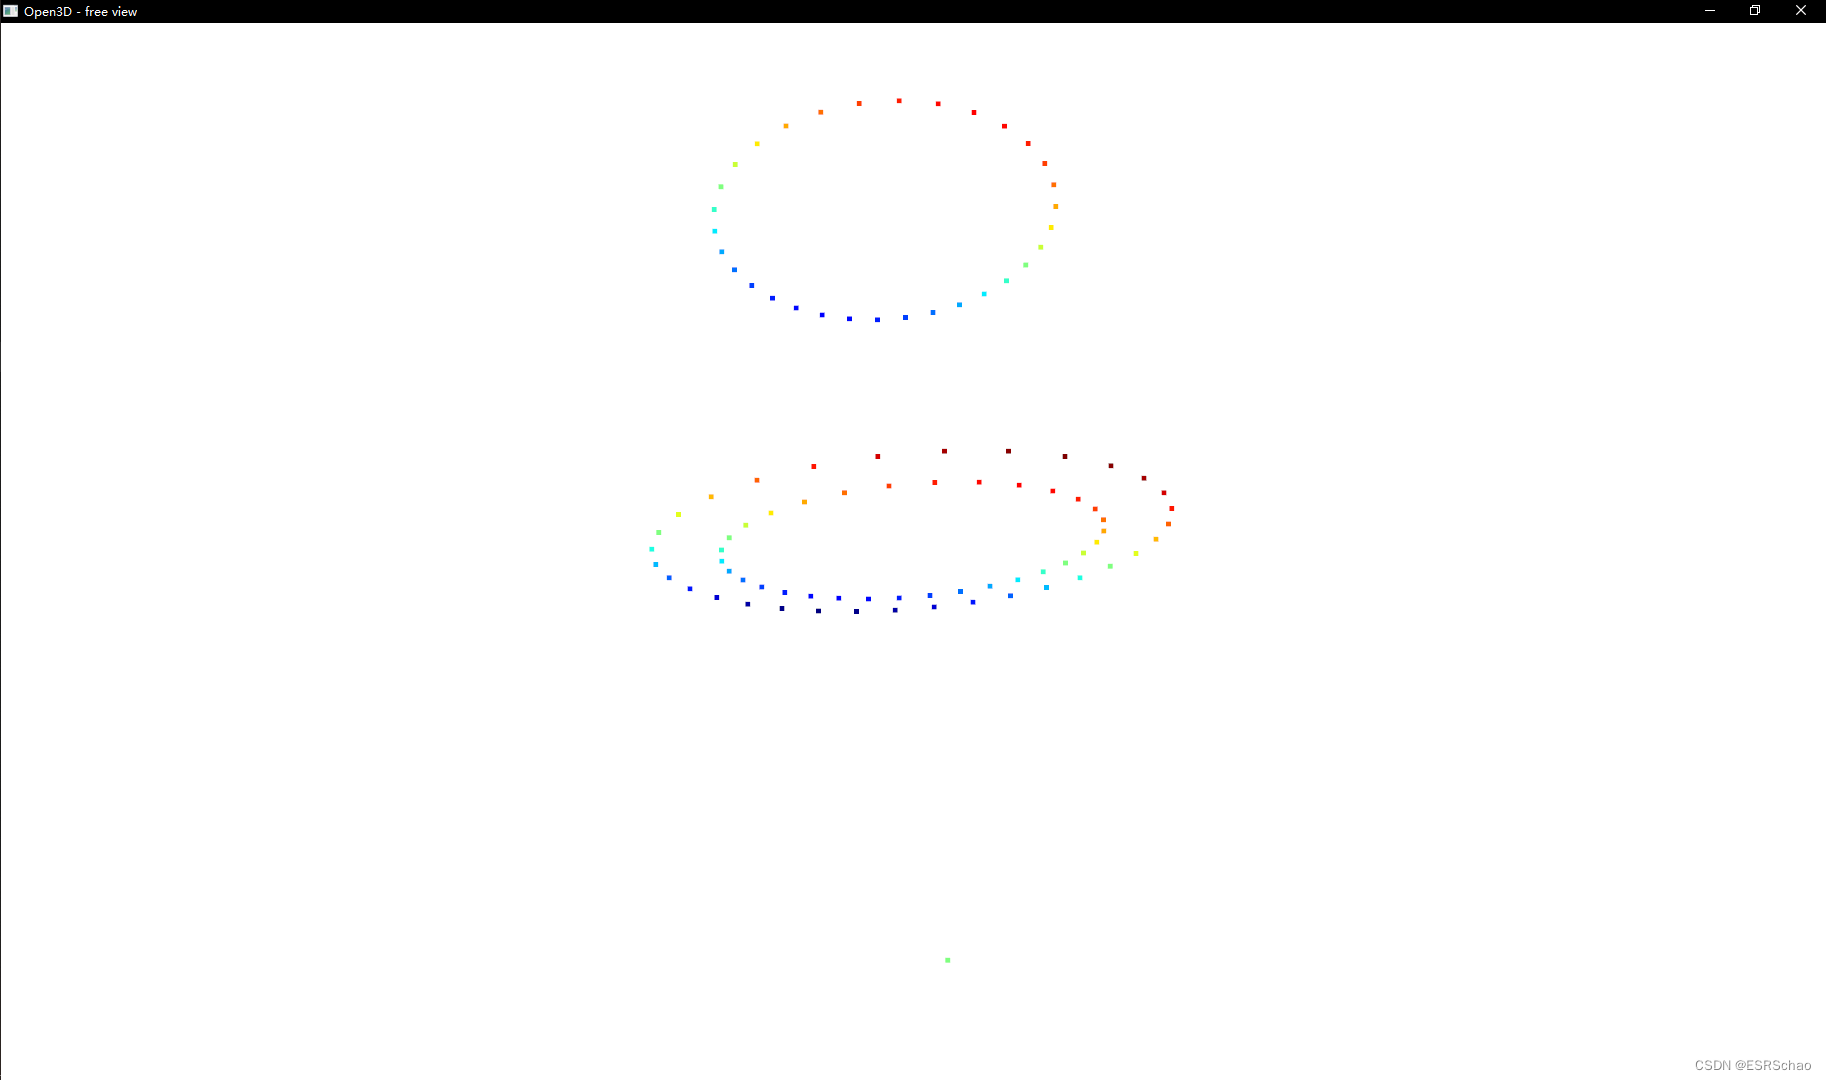
hold down the shift key
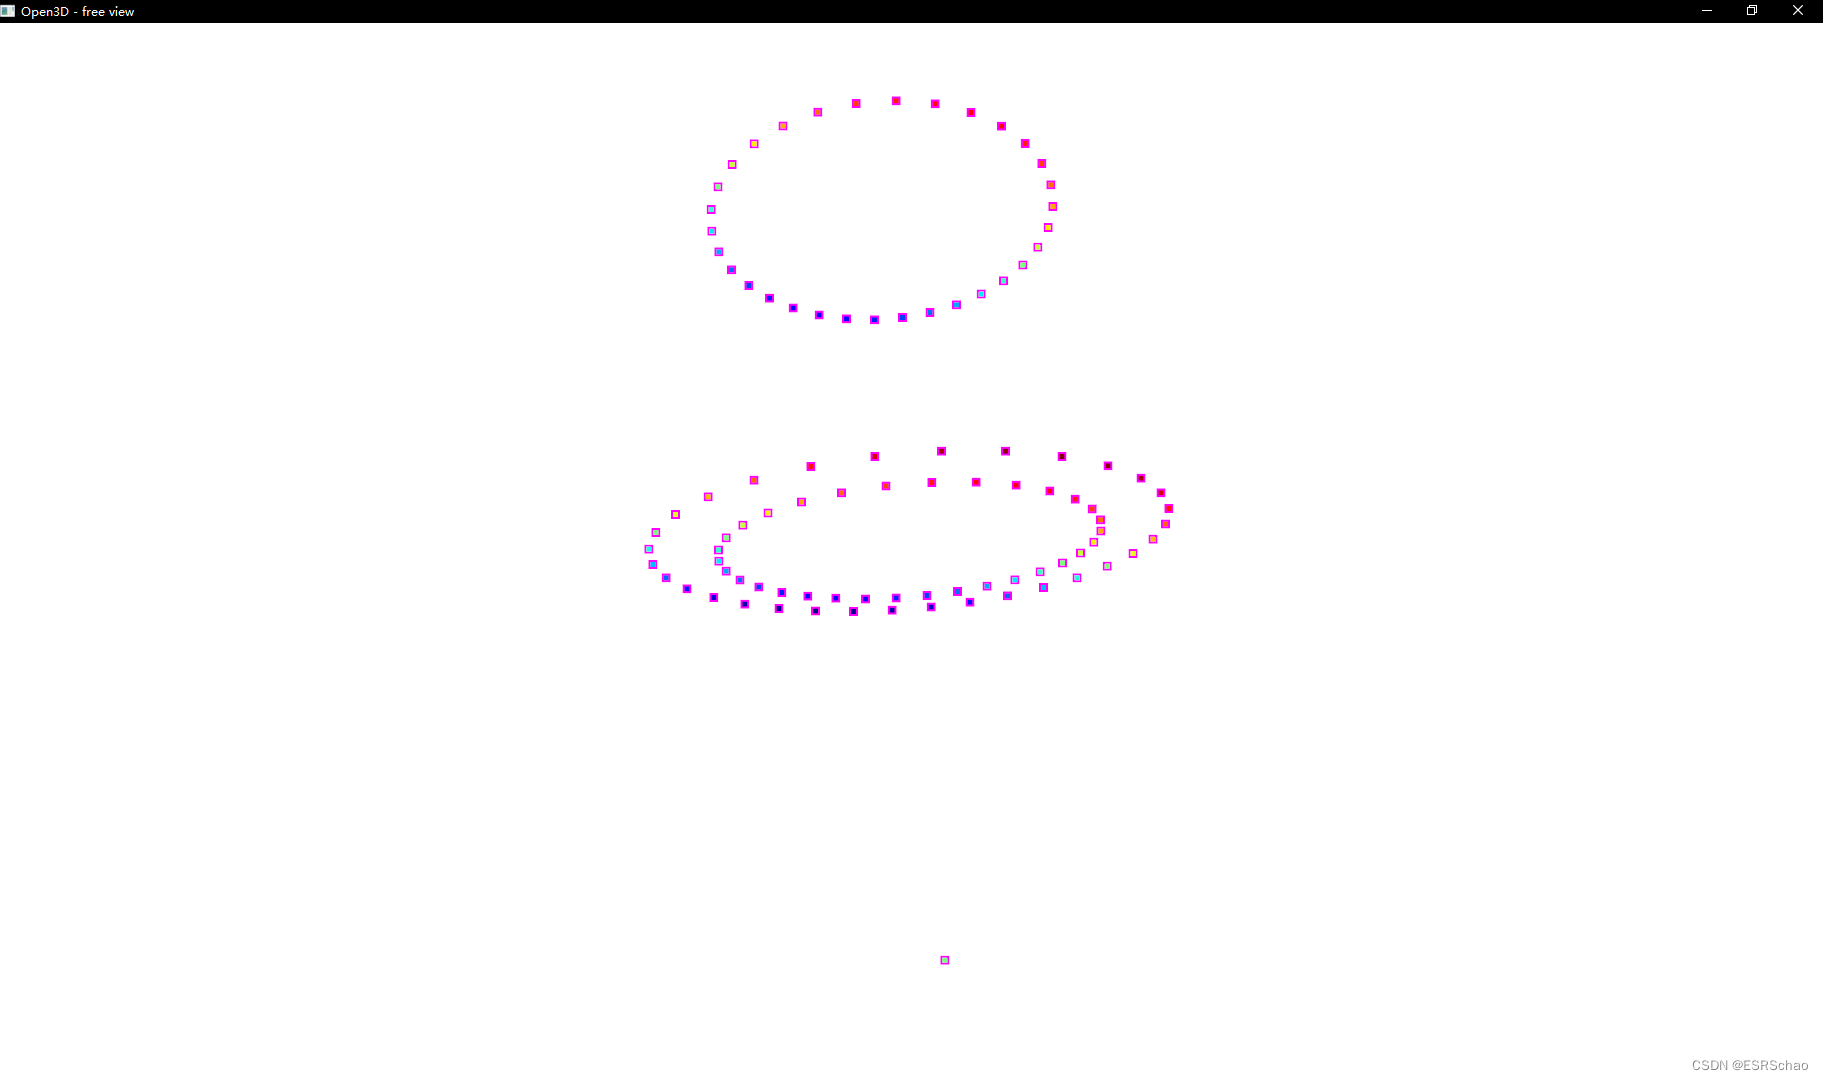
Pick one or more points (selected points are shown in green)
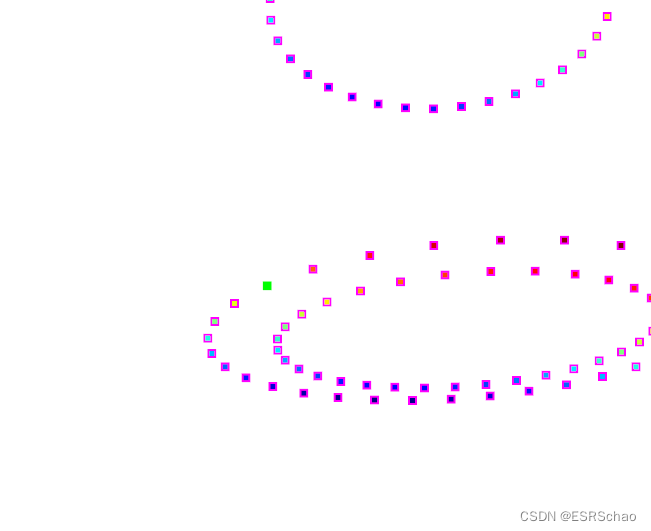
Close the window to get the information of the selected point
and the information will be stored in the point list

In this way, the visual interaction of the point cloud is realized. We can obtain the information of one or a part of points by directly selecting in the visual interface, and then can directly process it in the subsequent program.
It is not easy to write a tutorial. If it is helpful to you, please like or bookmark it. Thank you.
Category of website: technical article > Blog
Author:gfg
link:http://www.pythonblackhole.com/blog/article/305/8da83690f7a8be376319/
source:python black hole net
Please indicate the source for any form of reprinting. If any infringement is discovered, it will be held legally responsible.
name:
Comment content: (supports up to 255 characters)
no articles