
Python crawls weather data and performs visual analysis
posted on 2023-05-21 18:07 read(1141) comment(0) like(16) collect(5)
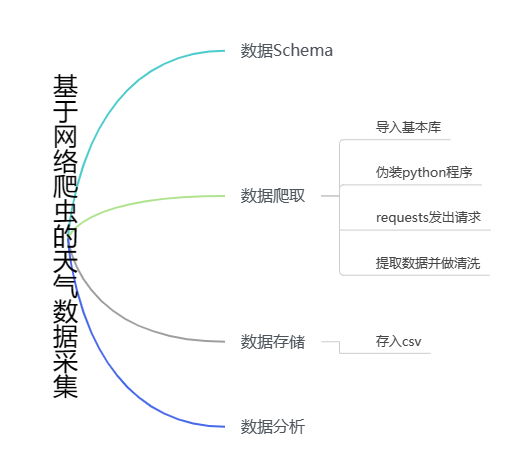
Historical weather data schema
{
'Information of the day': '2023-01-01 Sunday',
'Maximum temperature': 8℃'',
'Minimum temperature': '5℃',
'Weather': 'Cloudy',
'Wind direction information': 'North wind 3'
}
1. Import library
- import numpy as np
- import pandas as pd
- import requests
- from bs4 import BeautifulSoup
- from matplotlib import pyplot as plt
- from pandas import Series, DataFrame
2. Disguise the program
- headers = {
- 'Host': 'lishi.tianqi.com',
- 'user-agent': 'Mozilla/5.0 (Windows NT 10.0; Win64; x64) AppleWebKit/537.36 (KHTML, like Gecko) Chrome/110.0.0.0 Safari/537.36 Edg/110.0.1587.63'
- }
3. Capture weather data
- url = 'https://lishi.tianqi.com/shanghai/202301.html' # 上海 2023年1月天气
- res = requests.get(url, headers=headers)
-
- res.encodind = 'utf-8'
- html = BeautifulSoup(res.text, 'html.parser')
- data_all = []
- tian_three = html.find("div", {"class": "tian_three"})
- lishi = tian_three.find_all("li")
- for i in lishi:
- lishi_div = i.find_all("div")
- data = []
- for j in lishi_div:
- data.append(j.text)
- data_all.append(data)
- print(data_all)

4. Data storage
Before the data is stored, the data is processed to facilitate the later data analysis. Split the "Today Information" field above into two fields, "Date" and "Week", and the same goes for "Wind Information". Finally, save the data as a csv file.
- weather = pd.DataFrame(data_all)
- weather.columns = ["当日信息", "最高气温", "最低气温", "天气", "风向信息"]
- weather_shape = weather.shape
- print(weather)
- weather['当日信息'].apply(str)
- result = DataFrame(weather['当日信息'].apply(lambda x: Series(str(x).split(' '))))
- result = result.loc[:, 0:1]
- result.columns = ['日期', '星期']
- weather['风向信息'].apply(str)
- result1 = DataFrame(weather['风向信息'].apply(lambda x: Series(str(x).split(' '))))
- result1 = result1.loc[:, 0:1]
- result1.columns = ['风向', '级数']
- weather = weather.drop(columns='当日信息')
- weather = weather.drop(columns='风向信息')
- weather.insert(loc=0, column='日期', value=result['日期'])
- weather.insert(loc=1, column='星期', value=result['星期'])
- weather.insert(loc=5, column='风向', value=result1['风向'])
- weather.insert(loc=6, column='级数', value=result1['级数'])
- weather.to_csv("上海23年1月天气.csv", encoding="utf_8")
5. Data analysis
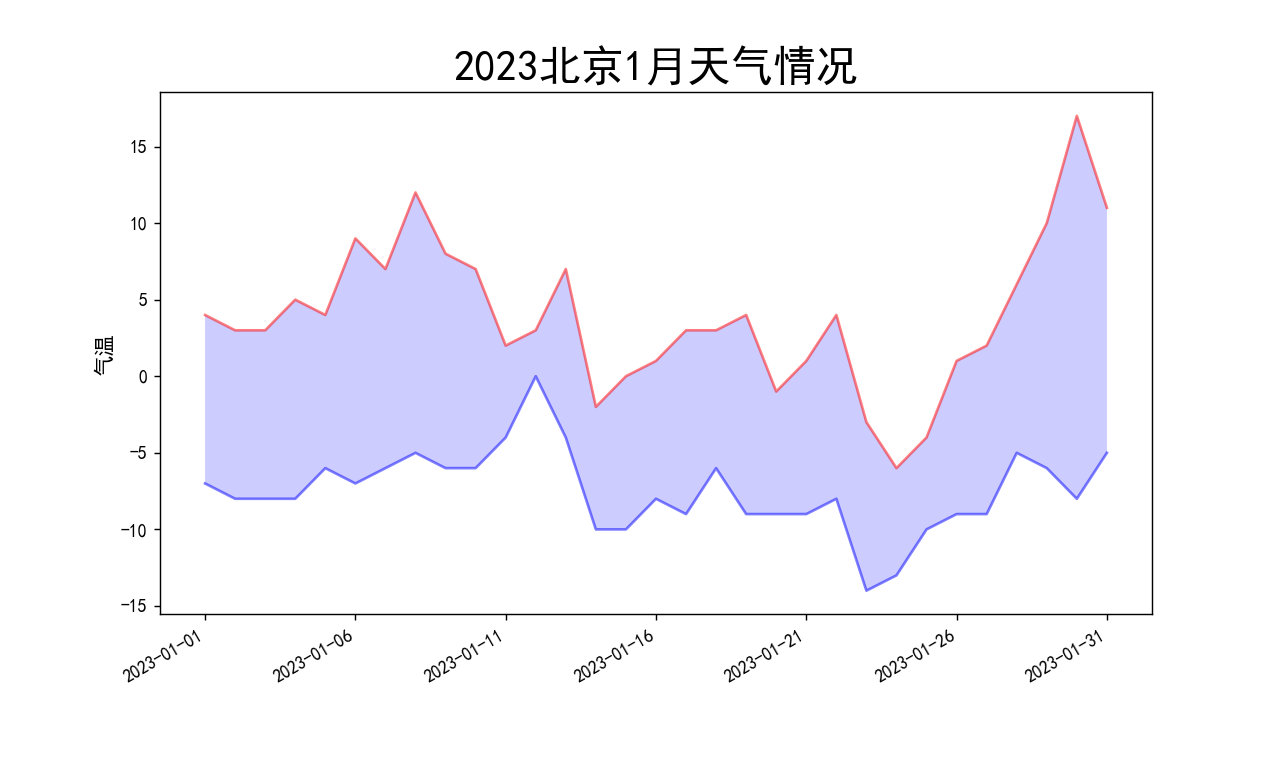
Note: The data analysis uses the weather data of Beijing in January 2023, as shown in the figure below:

1. Weather conditions in Beijing in January 2023
- # 数据处理
- plt.rcParams['font.sans-serif'] = ['SimHei']
- plt.rcParams['axes.unicode_minus'] = False
-
-
- weather['最高气温'] = weather['最高气温'].map(lambda x: int(x.replace('℃', '')))
- weather['最低气温'] = weather['最低气温'].map(lambda x: int(x.replace('℃', '')))
-
- dates = weather['日期']
- highs = weather['最高气温']
- lows = weather['最低气温']
-
- # 画图
-
- fig = plt.figure(dpi=128, figsize=(10, 6))
-
- plt.plot(dates, highs, c='red', alpha=0.5)
- plt.plot(dates, lows, c='blue', alpha=0.5)
-
- plt.fill_between(dates, highs, lows, facecolor='blue', alpha=0.2)
- # 图表格式
- # 设置图标的图形格式
- plt.title('2023北京1月天气情况', fontsize=24)
- plt.xlabel('', fontsize=6)
- fig.autofmt_xdate()
- plt.ylabel('气温', fontsize=12)
- plt.tick_params(axis='both', which='major', labelsize=10)
- # 修改刻度
- plt.xticks(dates[::5])
- # 显示
- plt.show()
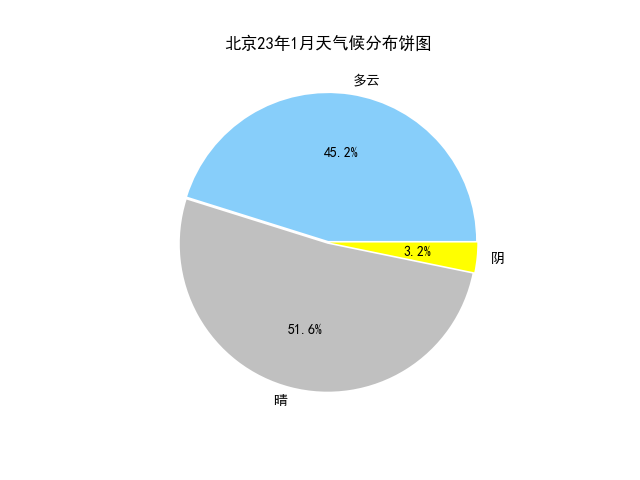
2. Pie chart of climate distribution in Beijing in January 2023
There are 31 days in January 2023, pay attention to the number of cycles when looping through.
- # 天气可视化饼图
- weather = list(weather['天气'])
- dic_wea = {}
- for i in range(0, 31):
- if weather[i] in dic_wea.keys():
- dic_wea[weather[i]] += 1
- else:
- dic_wea[weather[i]] = 1
- print(dic_wea)
- explode = [0.01] * len(dic_wea.keys())
- color = ['lightskyblue', 'silver', 'yellow', 'salmon', 'grey', 'lime', 'gold', 'red', 'green', 'pink']
- plt.pie(dic_wea.values(), explode=explode, labels=dic_wea.keys(), autopct='%1.1f%%', colors=color)
- plt.title('北京23年1月天气候分布饼图')
- plt.show()
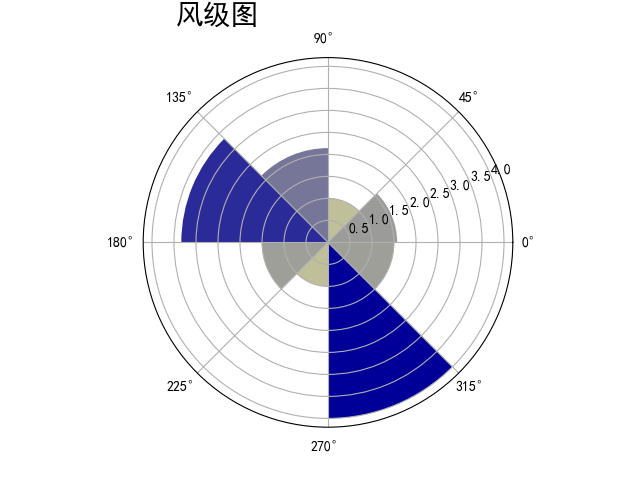
3. Wind Scale Chart
Customize the change_wind function to convert the wind direction information into a value, and calculate the average wind speed of each wind direction.
- def change_wind(wind):
- """改变风向"""
- for i in range(0, 31):
- if wind[i] == "北风":
- wind[i] = 90
- elif wind[i] == "南风":
- wind[i] = 270
- elif wind[i] == "西风":
- wind[i] = 180
- elif wind[i] == "东风":
- wind[i] = 360
- elif wind[i] == "东北风":
- wind[i] = 45
- elif wind[i] == "西北风":
- wind[i] = 135
- elif wind[i] == "西南风":
- wind[i] = 225
- elif wind[i] == "东南风":
- wind[i] = 315
- return wind
-
-
- # 风向雷达图
- wind = list(weather['风向'])
- weather['级数'] = weather['级数'].map(lambda x: int(x.replace('级', '')))
- # weather['级数']=pd.to_numeric(weather['级数'])
- wind_speed = list(weather['级数'])
- wind = change_wind(wind)
-
-
- degs = np.arange(45, 361, 45)
- temp = []
- for deg in degs:
- speed = []
- # 获取 wind_deg 在指定范围的风速平均值数据
- for i in range(0, 31):
- if wind[i] == deg:
- speed.append(wind_speed[i])
- if len(speed) == 0:
- temp.append(0)
- else:
- temp.append(sum(speed) / len(speed))
- print(temp)
- N = 8
- theta = np.arange(0. + np.pi / 8, 2 * np.pi + np.pi / 8, 2 * np.pi / 8)
- # 数据极径
- radii = np.array(temp)
- # 绘制极区图坐标系
- plt.axes(polar=True)
- # 定义每个扇区的RGB值(R,G,B),x越大,对应的颜色越接近蓝色
- colors = [(1 - x / max(temp), 1 - x / max(temp), 0.6) for x in radii]
- plt.bar(theta, radii, width=(2 * np.pi / N), bottom=0.0, color=colors)
- plt.title('风级图', x=0.2, fontsize=20)
- plt.show()
Category of website: technical article > Blog
Author:python98k
link:http://www.pythonblackhole.com/blog/article/25350/b11af16226bed7f2defa/
source:python black hole net
Please indicate the source for any form of reprinting. If any infringement is discovered, it will be held legally responsible.
name:
Comment content: (supports up to 255 characters)