Matplotlib plots add titles, legends, grids, reference lines, annotation text, mathematical expressions, labels, and modify scales
posted on 2023-05-21 18:03 read(651) comment(0) like(13) collect(0)
Matplotlib plots add titles, legends, grids, reference lines, annotation text, mathematical expressions, labels, and modify scales
Matplotlib plots add titles, legends, grids, reference lines, annotation text, mathematical expressions, labels, and modify scales
matplotlib draws histograms, pie charts, scatter plots , bubble charts, box plots, radar charts http://t.csdn.cn/ZeXim
Parameter configuration of matplotlib: http://t.csdn.cn/TiI79
1. Set the labels of the x-axis and y-axis
xlabel(xlabel,fontdict=None,labelpad=None)
ylabel(ylabel,fontdict=None,labelpad=None)
-
xlabel/ylabel: Indicates the label text of the x-axis (y-axis).
-
fontdict: Represents a dictionary that controls the text style of the label.
-
labelpad: Indicates the distance between the label and the axis frame (including scale and scale label).
Sample code:
# 标签
import numpy as np
import matplotlib.pyplot as plt
# 支持中文
plt.rcParams['font.sans-serif'] = ['SimHei']  # 用来正常显示中文标签
plt.rcParams['axes.unicode_minus'] = False  # 用来正常显示负号
x=np.linspace(-np.pi,np.pi,256,endpoint=True)
y1,y2=np.sin(x),np.cos(x)
plt.plot(x,y1,x,y2)
# 设置标签
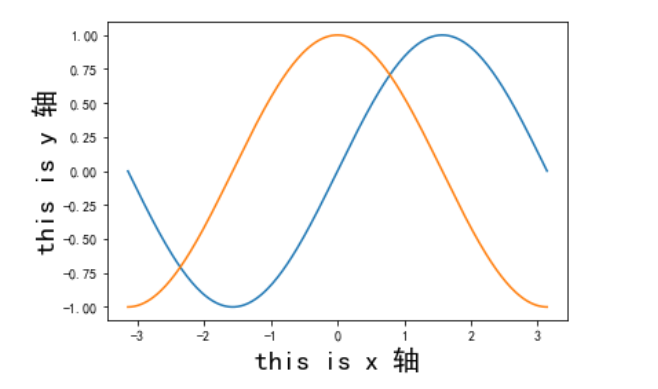
plt.xlabel("this is x 轴",size=20)
plt.ylabel("this is y 轴",size=20)
plt.show()
2. Set the scale range
Use the xlim, ylim functions to set the range of the x-axis and y-axis
xlim(left=None,right=None,emit=True,auto=False,xmin=None,xmax=None)
ylim(left=None,right=None,emit=True,auto=False,ymin=None,ymax=None)
- Use xmin(ymin) and xmax(ymax) to set
# 标签
import numpy as np
import matplotlib.pyplot as plt
# 支持中文
plt.rcParams['font.sans-serif'] = ['SimHei']  # 用来正常显示中文标签
plt.rcParams['axes.unicode_minus'] = False  # 用来正常显示负号
x=np.linspace(-np.pi,np.pi,256,endpoint=True)
y1,y2=np.sin(x),np.cos(x)
plt.plot(x,y1,x,y2)
# 设置标签
plt.xlabel("this is x 轴",size=20)
plt.ylabel("this is y 轴",size=20)
# 刻度标签
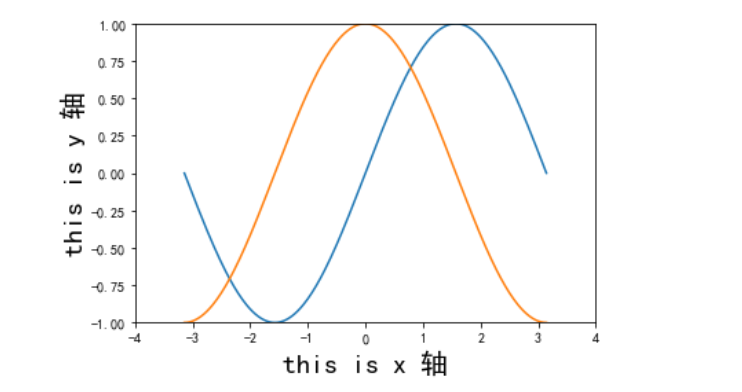
plt.xlim(-4,4)
plt.ylim(-1,1)
plt.show()
3. Add title and legend
title
title(label,fontdict=None,loc="center",pad=None)
Mainly here this loc
- loc: Indicates the alignment style of the title, including left, right, center
- pad: Indicates the distance between the title and the top of the chart, the default is None
legend
legend(handles,labels,loc)
- loc: The position of the legend can be selected here as upper right, upper left, lowerleft, lowright ... It is recommended to choose loc='best'
# 标签
import numpy as np
import matplotlib.pyplot as plt
# 支持中文
plt.rcParams['font.sans-serif'] = ['SimHei']  # 用来正常显示中文标签
plt.rcParams['axes.unicode_minus'] = False  # 用来正常显示负号
x=np.linspace(-np.pi,np.pi,256,endpoint=True)
y1,y2=np.sin(x),np.cos(x)
pic=plt.plot(x,y1,x,y2)
# 设置标签
plt.xlabel("this is x 轴",size=20)
plt.ylabel("this is y 轴",size=20)
# 刻度标签
plt.xlim(-4,4)
plt.ylim(-1,1)
# 添加标题
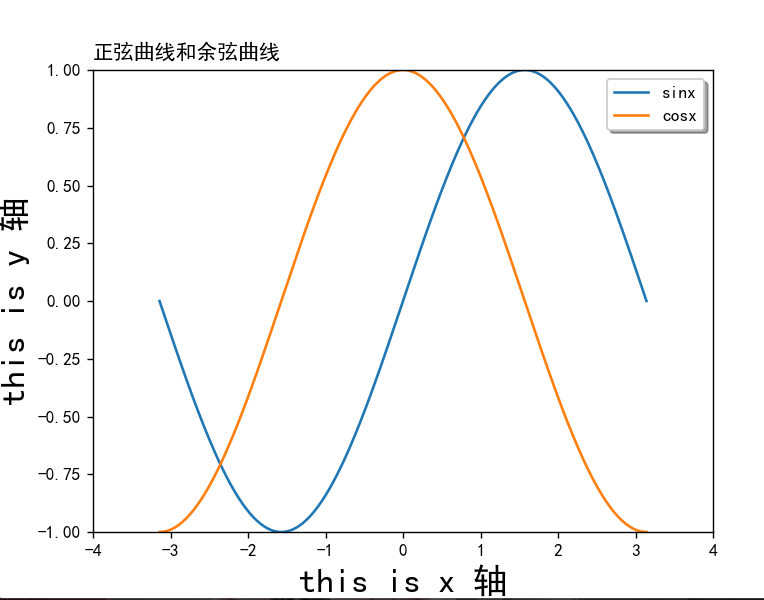
plt.title("正弦曲线和余弦曲线",loc="left")
# 添加图例
plt.legend(pic,["sinx","cosx"],shadow=True,fancybox="blue")
plt.show()
4. Display grid
This is simple, plt.grid()just fine, but there are still some parameters in it
grid(b=True,axis="both",which='major')
-
which: display the type of grid, support major, minor, both defaults to major
-
axis: Indicates which direction to display the grid, there are three options x, y, and both
-
linewidth or lw: the width of the line
Default :
# 标签
import numpy as np
import matplotlib.pyplot as plt

# 支持中文
plt.rcParams['font.sans-serif'] = ['SimHei']  # 用来正常显示中文标签
plt.rcParams['axes.unicode_minus'] = False  # 用来正常显示负号
x = np.linspace(-np.pi, np.pi, 256, endpoint=True)
y1, y2 = np.sin(x), np.cos(x)
pic = plt.plot(x, y1, x, y2)
# 设置标签
plt.xlabel("this is x 轴", size=20)
plt.ylabel("this is y 轴", size=20)
# 添加标题
plt.title("正弦曲线和余弦曲线", loc="left")
# 添加图例
plt.legend(pic, ["sinx", "cosx"], shadow=True, fancybox="blue")
# 网格
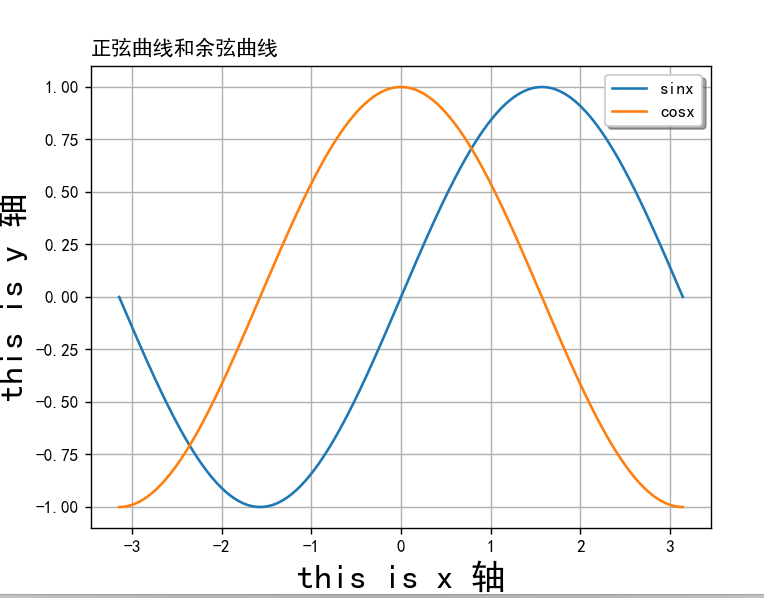
plt.grid()
plt.show()
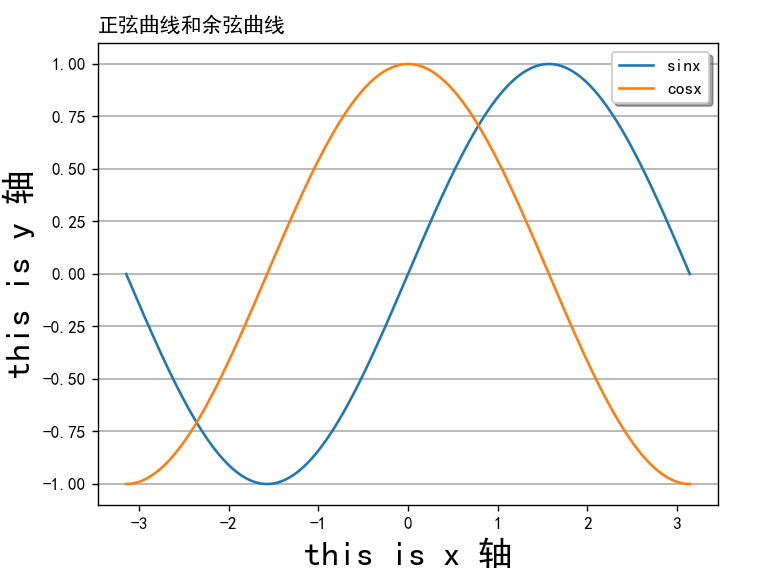
Select the grid to add the y axis, modify lw to 0.3
plt.grid(lw=1, axis="y")
5. Add horizontal guides and reference areas
1. Use axhline to add horizontal guide lines
axhline(y=0,xmin=0,xmax-1,linestyle="-")
-
y: Indicates the coordinates of the horizontal reference line
-
xmin: Indicates the starting position of the horizontal reference line, the default is 0
-
xmax: the end position of the horizontal reference line, the default is 1
-
linstyle: Indicates the type of horizontal reference line, the default is solid line
Other types of linstyle: http://t.csdn.cn/Ufbvt

2. Use axvline to draw vertical guide lines
The syntax of axvline is similar to that of axhline, only need to modify x and y
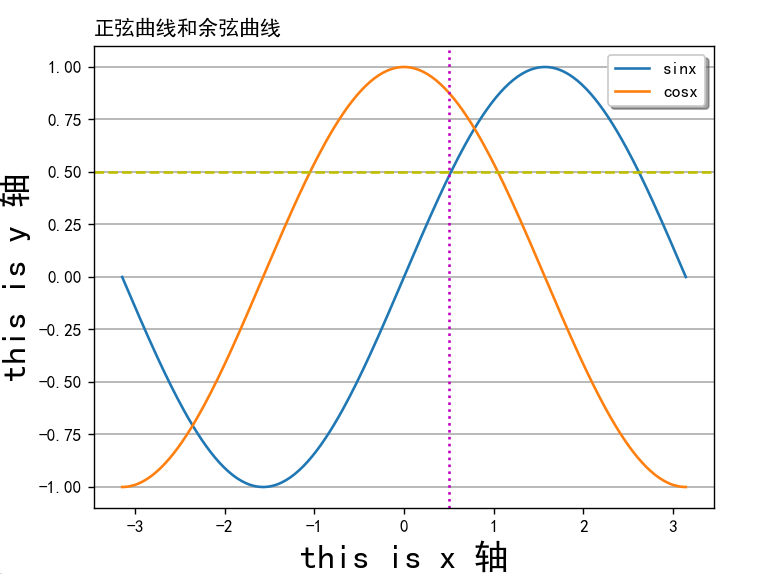
Example: Adding two reference lines to the image above:
# 标签
import numpy as np
import matplotlib.pyplot as plt

# 支持中文
plt.rcParams['font.sans-serif'] = ['SimHei']  # 用来正常显示中文标签
plt.rcParams['axes.unicode_minus'] = False  # 用来正常显示负号
x = np.linspace(-np.pi, np.pi, 256, endpoint=True)
y1, y2 = np.sin(x), np.cos(x)
pic = plt.plot(x, y1, x, y2)
# 设置标签
plt.xlabel("this is x 轴", size=20)
plt.ylabel("this is y 轴", size=20)
# 添加标题
plt.title("正弦曲线和余弦曲线", loc="left")
# 添加图例
plt.legend(pic, ["sinx", "cosx"], shadow=True, fancybox="blue")
# 网格
plt.grid(lw=1, axis="y")
# 参考线
plt.axvline(x=0.5, linestyle=":", color="m")
plt.axhline(y=0.5, linestyle="--", color="y")
plt.show()
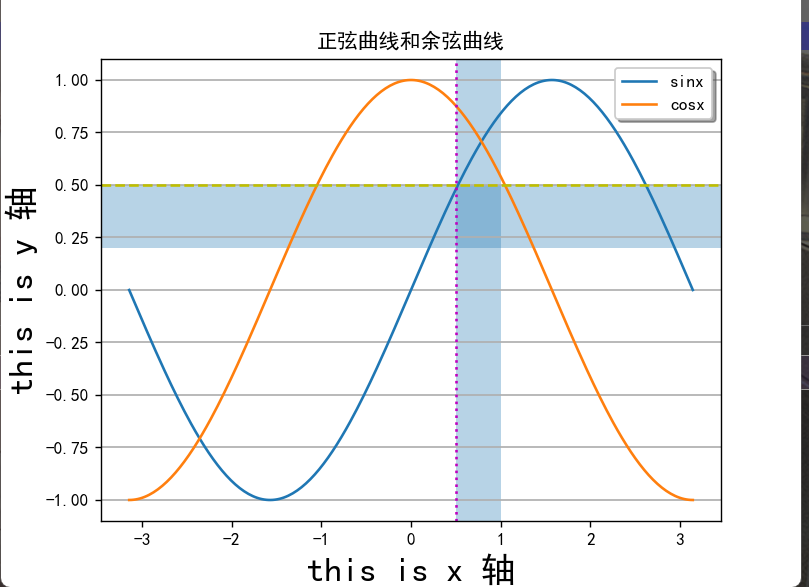
3. Use axhspan and axvspan to add reference areas
axhspan(ymin,ymax,xmin,xmax)
axvspan(ymin,ymax,xmin,xmax)
- ymin: Indicates the lower limit of the horizontal span
- ymax represents the upper limit of the horizontal span
- xmin: Indicates the lower limit of the vertical span
- xmax: Indicates the upper limit of the vertical span
# 标签
import numpy as np
import matplotlib.pyplot as plt

# 支持中文
plt.rcParams['font.sans-serif'] = ['SimHei']  # 用来正常显示中文标签
plt.rcParams['axes.unicode_minus'] = False  # 用来正常显示负号
x = np.linspace(-np.pi, np.pi, 256, endpoint=True)
y1, y2 = np.sin(x), np.cos(x)
pic = plt.plot(x, y1, x, y2)
# 设置标签
plt.xlabel("this is x 轴", size=20)
plt.ylabel("this is y 轴", size=20)
# 添加标题
plt.title("正弦曲线和余弦曲线")
# 添加图例
plt.legend(pic, ["sinx", "cosx"], shadow=True, fancybox="blue")
# 网格
plt.grid(lw=1, axis="y")
# 参考线
plt.axvline(x=0.5, linestyle=":", color="m")
plt.axhline(y=0.5, linestyle="--", color="y")
# 参考区域
plt.axvspan(xmin=0.5, xmax=1, alpha=0.32)
plt.axhspan(ymin=0.2, ymax=0.5, alpha=0.32)

plt.show()
Six: Add comment text
1. Directional text
anootate(s,xy,xytext,xycoords,arrowprops,bbox)
- s: indicates the text content of the comment
- xy: the coordinate position of the point representing the annotation, accepting tuple (x, y)
- xytext: Indicates the coordinate position of the annotation text
- xycoords: Indicates the coordinate system of xy, which uses the same coordinate system as the polyline by default
- bbox: A dictionary of attributes representing the border of the annotation text
- arrowprops: a dictionary of properties representing knowledge arrows
The arrowprops parameters are as follows:

2. Non-directional text annotation text
text(x,y,s,fontdict=None,bbox)
-
x, y: Indicates the position of the annotation text.
-
s: Indicates the content of the annotation text.
-
fontdict: A dictionary representing the control font.
-
bbox: Indicates the border attribute bullet of the annotation text
For example:
# 标签
import numpy as np
import matplotlib.pyplot as plt

# 支持中文
plt.rcParams['font.sans-serif'] = ['SimHei']  # 用来正常显示中文标签
plt.rcParams['axes.unicode_minus'] = False  # 用来正常显示负号
x = np.linspace(-np.pi, np.pi, 256, endpoint=True)
y1, y2 = np.sin(x), np.cos(x)
pic = plt.plot(x, y1, x, y2)
# 设置标签
plt.xlabel("x 轴", size=20)
plt.ylabel("y 轴", size=20)
# 添加标题
plt.title("正弦曲线和余弦曲线")
# 添加图例
plt.legend(pic, ["sinx", "cosx"], shadow=True, fancybox="blue")
# 网格
plt.grid()
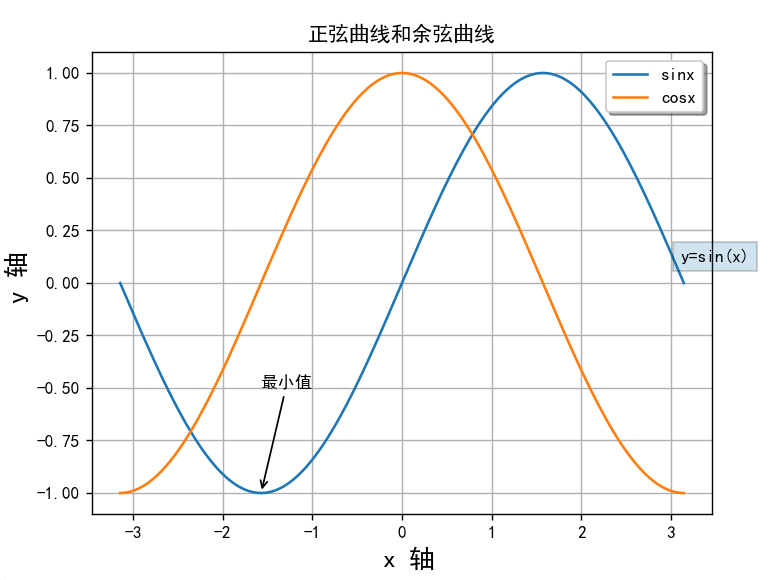
plt.annotate("最小值", xy=(-np.pi / 2, -1.0), xytext=((-np.pi / 2), -0.5), arrowprops=dict(arrowstyle="->"))
plt.text(3.1, 0.1, "y=sin(x)", bbox=dict(alpha=0.2))
plt.show()
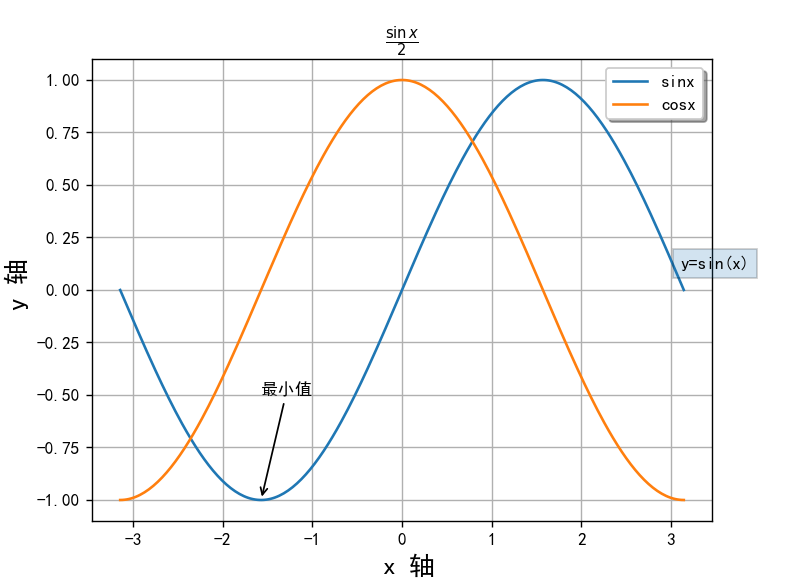
7. Add math formulas
Just use latetx or katex syntax
For example, r"$\sin x$"it will appear as
sin
x
\sin x
sinx
Modify the title here
    # 标签
    import numpy as np
    import matplotlib.pyplot as plt

    # 支持中文
    plt.rcParams['font.sans-serif'] = ['SimHei']  # 用来正常显示中文标签
    plt.rcParams['axes.unicode_minus'] = False  # 用来正常显示负号
    x = np.linspace(-np.pi, np.pi, 256, endpoint=True)
    y1, y2 = np.sin(x), np.cos(x)
    pic = plt.plot(x, y1, x, y2)
    # 设置标签
    plt.xlabel(" x 轴", size=15)
    plt.ylabel(" y 轴", size=15)
    # 添加标题
    plt.title(r'$\frac{\sin x}{2}$')
    # 添加图例
    plt.legend(pic, ["sinx", "cosx"], shadow=True, fancybox="blue")
    # 网格
    plt.grid()
    plt.annotate("最小值", xy=(-np.pi / 2, -1.0), xytext=((-np.pi / 2), -0.5), arrowprops=dict(arrowstyle="->"))
    plt.text(3.1, 0.1, "y=sin(x)", bbox=dict(alpha=0.2))
    plt.show()
Reference link: Matplotlib — Visualization with Python
Reference Book: Python Data Visualization%20 (Dark Horse Programmer)
Category of website: technical article > Blog
Author:Sweethess
link:http://www.pythonblackhole.com/blog/article/25336/bc765e0fc8d84026be03/
source:python black hole net
Please indicate the source for any form of reprinting. If any infringement is discovered, it will be held legally responsible.
name:
Comment content: (supports up to 255 characters)
no articles
