
Python 大作业 网易云歌单数据分析及可视化(参考多位博主文章)
posted on 2023-05-21 18:21 read(951) comment(0) like(28) collect(1)
Table of contents
Data Analysis and Visualization
4.2 Top 10 song list favorites
4.4 Distribution of songs included in playlists
4.4.2 Effect and visualization
4.6 Top 10 Song List Contributions
4.7 Song list name generation word cloud
4.7.2 Results and visualization
Project Overview
1.1 Project source
NetEase Cloud Music is a music product developed by NetEase. It is the result of NetEase Hangzhou Research Institute. Relying on professional musicians, DJs, friend recommendations and social functions, the online music service mainly focuses on playlists, social networking, big-name recommendations and music fingerprints. Playlists, DJ programs, social networking, and geographic location are the core elements, focusing on discovery and sharing. Crawl the song list part of the official website of Netease Cloud Music, obtain data from the song list of Netease Cloud Music, get all the song lists of a certain song style, and get the name, label, introduction, collection volume, playback volume, and song list of the song list The number of songs included in the list, as well as the number of comments.
1.2 Requirement description
Preprocess the crawled data, analyze the preprocessed data, and analyze the playlist volume, playlist collection volume, songlist comment volume, songlist song collection status, songlist labels, and playlist contribution up The master and the like conduct analysis and visualization to reflect the analysis results more intuitively.
2.1 Selection of data sources
Listening to music is a way for many young people to express their emotions. Netease Cloud Music is a popular music platform. By analyzing the song list of Netease Cloud Music, we can understand the problems faced by young people in today's society, and Emotional pressure in all aspects; you can also understand the preferences of users, analyze what kind of song list is the most popular among the public, and reflect the preferences of the public, which also plays a very important role in the creation of music creators. From the point of view of ordinary users, for creators of playlists, on the one hand, creation of playlists facilitates the classification and management of their own collection of music libraries; on the other hand, producing high-quality playlists can highlight their own music taste, Gain likes and comments, and get a great sense of accomplishment and satisfaction. For song list consumers, listening to songs based on the "song list" can greatly improve the user experience of listening to songs. For songlist creators such as musicians and radio hosts, the "songlist" can better disseminate their music and works, and also better interact with fans and expand their popularity.
This project crawls the data of the Chinese song list on the official website of Netease Cloud, and the crawling address is: Chinese song list - song list - NetEase Cloud Music
2.2 Data Acquisition
2.2.1 Design
Enter each page, get each song list of the page, and enter a single song list, the name of the song list, the number of favorites, the number of comments, tags, introduction, total number of songs, number of plays, titles of songs and other data are stored on the web page In the same div of , select each content through the selector selector .
2.2.2 Implementation
- from bs4 import BeautifulSoup
- import requests
- import time
-
- headers = {
- 'User-Agent': 'Mozilla/5.0 (Windows NT 6.1; WOW64) AppleWebKit/537.36 (KHTML, like Gecko) Chrome/63.0.3239.132 Safari/537.36'
- }
-
- for i in range(0, 1330, 35):
- print(i)
- time.sleep(2)
- url = 'https://music.163.com/discover/playlist/?cat=华语&order=hot&limit=35&offset=' + str(i)#修改这里即可
- response = requests.get(url=url, headers=headers)
- html = response.text
- soup = BeautifulSoup(html, 'html.parser')
- # 获取包含歌单详情页网址的标签
- ids = soup.select('.dec a')
- # 获取包含歌单索引页信息的标签
- lis = soup.select('#m-pl-container li')
- print(len(lis))
- for j in range(len(lis)):
- # 获取歌单详情页地址
- url = ids[j]['href']
- # 获取歌单标题
- title = ids[j]['title']
- # 获取歌单播放量
- play = lis[j].select('.nb')[0].get_text()
- # 获取歌单贡献者名字
- user = lis[j].select('p')[1].select('a')[0].get_text()
- # 输出歌单索引页信息
- print(url, title, play, user)
- # 将信息写入CSV文件中
- with open('playlist.csv', 'a+', encoding='utf-8-sig') as f:
- f.write(url + ',' + title + ',' + play + ',' + user + '\n')
-
- from bs4 import BeautifulSoup
- import pandas as pd
- import requests
- import time
-
- df = pd.read_csv('playlist.csv', header=None, error_bad_lines=False, names=['url', 'title', 'play', 'user'])
-
- headers = {
- 'User-Agent': 'Mozilla/5.0 (Windows NT 6.1; WOW64) AppleWebKit/537.36 (KHTML, like Gecko) Chrome/63.0.3239.132 Safari/537.36'
- }
-
- for i in df['url']:
- time.sleep(2)
- url = 'https://music.163.com' + i
- response = requests.get(url=url, headers=headers)
- html = response.text
- soup = BeautifulSoup(html, 'html.parser')
- # 获取歌单标题
- title = soup.select('h2')[0].get_text().replace(',', ',')
- # 获取标签
- tags = []
- tags_message = soup.select('.u-tag i')
- for p in tags_message:
- tags.append(p.get_text())
- # 对标签进行格式化
- if len(tags) > 1:
- tag = '-'.join(tags)
- else:
- tag = tags[0]
- # 获取歌单介绍
- if soup.select('#album-desc-more'):
- text = soup.select('#album-desc-more')[0].get_text().replace('\n', '').replace(',', ',')
- else:
- text = '无'
- # 获取歌单收藏量
- collection = soup.select('#content-operation i')[1].get_text().replace('(', '').replace(')', '')
- # 歌单播放量
- play = soup.select('.s-fc6')[0].get_text()
- # 歌单内歌曲数
- songs = soup.select('#playlist-track-count')[0].get_text()
- # 歌单评论数
- comments = soup.select('#cnt_comment_count')[0].get_text()
- # 输出歌单详情页信息
- print(title, tag, text, collection, play, songs, comments)
- # 将详情页信息写入CSV文件中
- with open('music_message.csv', 'a+', encoding='utf-8') as f:
- # f.write(title + '/' + tag + '/' + text + '/' + collection + '/' + play + '/' + songs + '/' + comments + '\n')
- f.write(title + ',' + tag + ',' + text + ',' + collection + ',' + play + ',' + songs + ',' + comments + '\n')

2.2.3 Effect
Store the relevant content in the corresponding .csv file. The music_message.csv file stores the name, label, introduction, number of collections, playback volume, number of songs included in the playlist, and number of comments. The playlist.csv file stores the address of the playlist details page, the title of the playlist, the play volume of the playlist, and the names of contributors to the playlist. The results are shown in Figure 2-1 and 2-2.
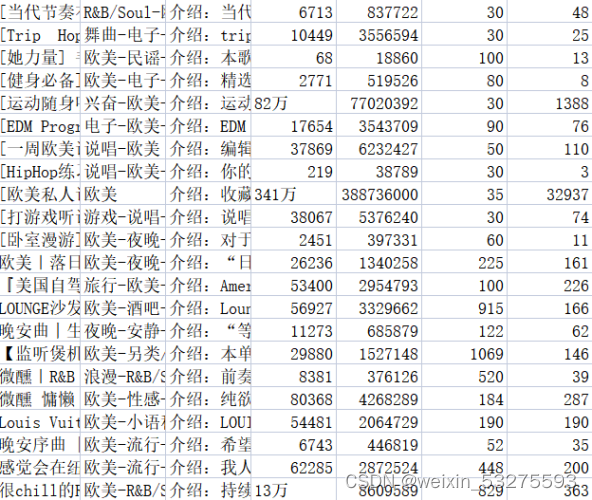
Figure 2-1 music_message.csv file content

Figure 2-2 content of playlist.csv file
Regarding data cleaning, in fact, part of it has been done in the process of capturing data in the previous part, including: empty song list information returned by the background , deduplication of duplicate data, etc. In addition, some cleaning needs to be done: unify the format of the comment volume data , etc.
3.1 Design
Replace the data with "ten thousand" in the number of comments with "0000" to facilitate subsequent data analysis, and fill in the data with "0" in the number of comments that are incorrectly counted, and do not participate in subsequent statistics.
3.2 Implementation
-
- df['collection'] = df['collection'].astype('string').str.strip()
- df['collection'] = [int(str(i).replace('万','0000')) for i in df['collection']]
- df['text'] = [str(i)[3:] for i in df['text']]
- df['comments'] = [0 if '评论' in str(i).strip() else int(i) for i in df['comments']]
3.3 Effect
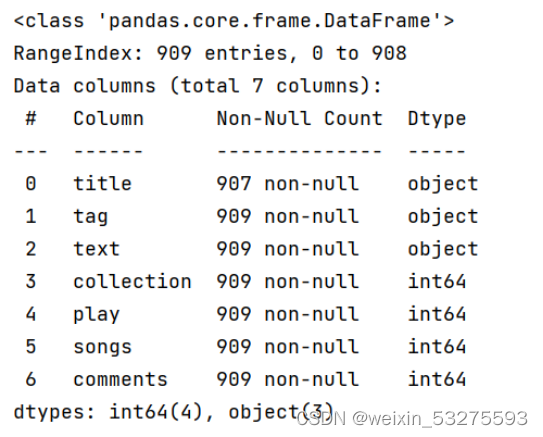
Figure 3-1 screenshot of program running
-
Data Analysis and Visualization
4.1 Top 10 Playlists
4.1.1 Implementation
- df_play = df[['title','play']].sort_values('play',ascending=False)
- df_play[:10]
- df_play = df_play[:10]
- _x = df_play['title'].tolist()
- _y = df_play['play'].tolist()
- df_play = get_matplot(x=_x,y=_y,chart='barh',title='网易云音乐华语歌单播放 TOP10',ha='left',size=8,color=color[0])
- df_play
4.1.2 Results
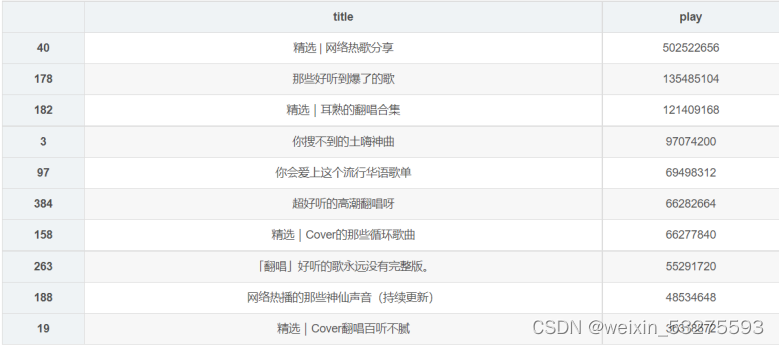
Figure 4-1 Screenshot of program running results
4.1.3 Visualization
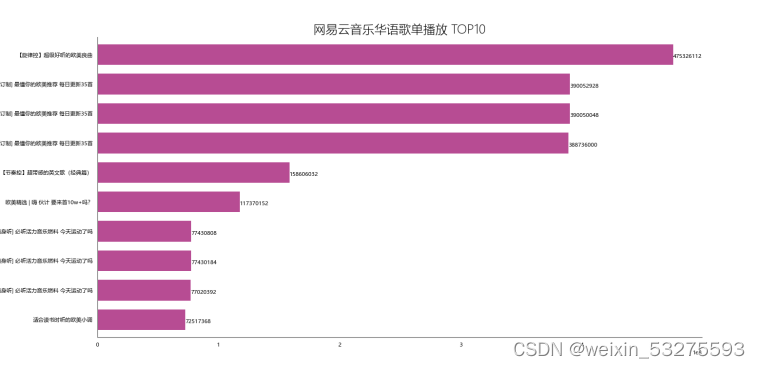
Figure 4-2 NetEase Cloud Music Chinese playlist TOP10
4.2 Top 10 song list favorites
4.2.1 Implementation
-
- df_col = df[['title','collection']].sort_values('collection',ascending=False)
- df_col[:10]
- df_col = df_col[:10]
- _x = df_col['title'].tolist()
- _y = df_col['collection'].tolist()
- df_col = get_matplot(x=_x,y=_y,chart='barh',title='网易云音乐华语歌单收藏 TOP10',ha='left',size=8,color=color[1])
- df_col
4.2.2 Results
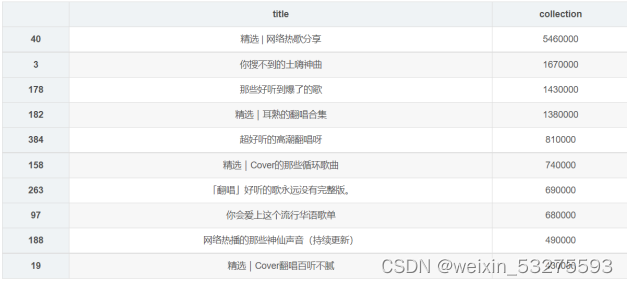
Figure 4-3 Screenshot of program running results
4.2.3 Visualization
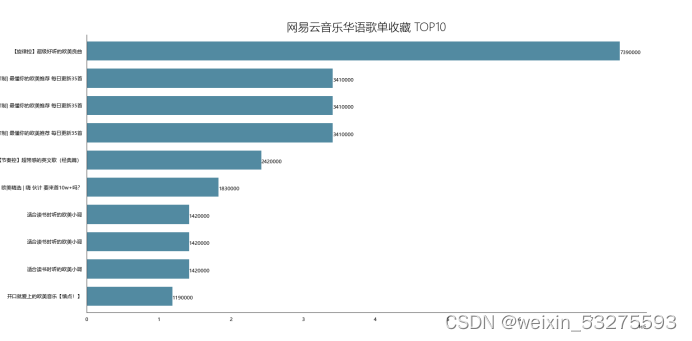
Figure 4-4 Netease Cloud Music Chinese song list collection TOP10
4.3 Top 10 song list comments
4.3.1 Implementation
-
- df_com = df[['title','comments']].sort_values('comments',ascending=False)
- df_com[:10]
- df_com = df_com[:10]
- _x = df_com['title'].tolist()
- _y = df_com['comments'].tolist()
- df_com = get_matplot(x=_x,y=_y,chart='barh',title='网易云音乐华语歌单评论数 TOP10',ha='left',size=8,color=color[2])
- df_com
4.3.2 Results
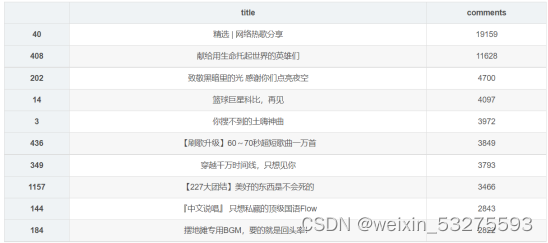
Figure 4-5 Screenshot of program running results
4.3.3 Visualization
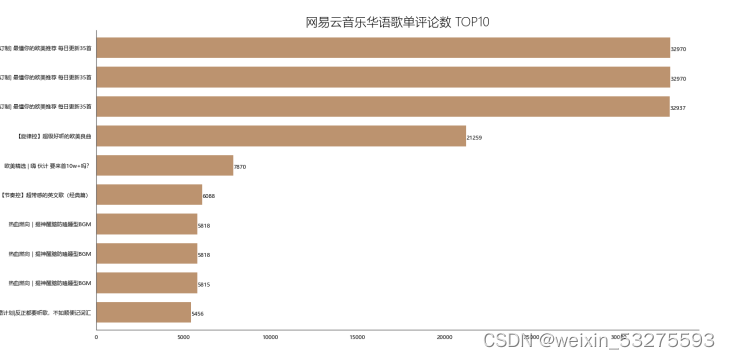
Figure 4-6 NetEase Cloud Music Chinese song list comments TOP10
4.4 Distribution of songs included in playlists
4.4.1 Implementation
- df_songs = np.log(df['songs'])
- df_songs
- df_songs = get_matplot(x=0,y=df_songs,chart='hist',title='华语歌单歌曲收录分布情况',ha='left',size=10,color=color[3])
- df_songs
4.4.2 Effect and visualization
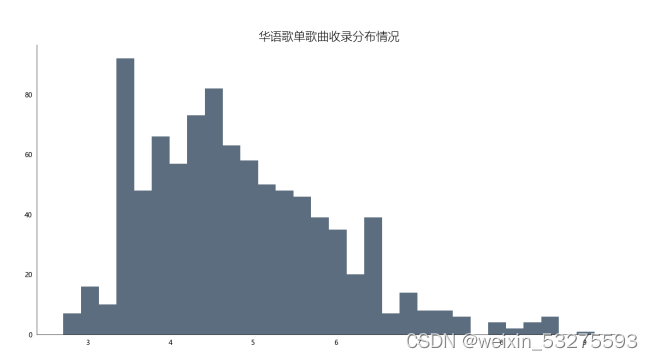
Figure 4-7 Distribution of Chinese song lists
4.4.3 Analysis
Through the analysis of the column chart, it is found that the collection of songs in the playlist is mostly concentrated in 20-60 songs, at most more than 80 songs, and there is also the phenomenon of empty playlists, but most of the playlists contain more than 10 songs. Through this visual analysis, subsequent creators can provide assistance to the collection of songs in their own playlists . It can also be more popular with the public.
4.5 Song list label map
4.5.1 Implementation
- def get_tag(df):
- df = df['tag'].str.split('-')
- datalist = list(set(x for data in df for x in data))
- return datalist
- df_tag = get_tag(df)
- # df_tag
- def get_lx(x,i):
- if i in str(x):
- return 1
- else:
- return 0
- for i in list(df_tag):#这里的df['all_category'].unique()也可以自己用列表构建,我这里是利用了前面获得的
- df[i] = df['tag'].apply(get_lx,i=f'{i}')
- # df.head()
- Series = df.iloc[:,7:].sum().sort_values(0,ascending=False)
- df_tag = [tag for tag in zip(Series.index.tolist(),Series.values.tolist())]
- df_tag[:10]
- df_iex = [index for index in Series.index.tolist()][:20]
- df_tag = [tag for tag in Series.values.tolist()][:20]
- df_tagiex = get_matplot(x=df_iex,y=df_tag,chart='plot',title='网易云音乐华语歌单标签图',size=10,ha='center',color=color[3])
- df_tagiex
4.5.2 Results
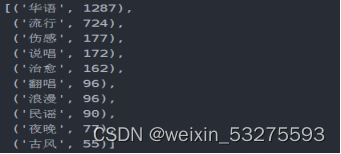
Figure 4-8 Chinese song list labels
4.5.3 Visualization
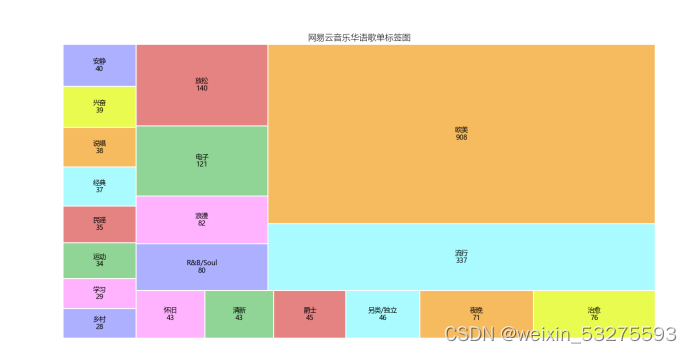
Figure 4-9 Song list label map
4.5.4 Analysis
You can see the style of the song list through this label map, and you can analyze the emotions of the current mainstream songs, as well as the needs of the public, as well as the music preferences of NetEase Cloud Music users. The content is relatively diversified: domestic popular, European and American pop, electronic, music and other styles are involved.
4.6 Top 10 Song List Contributions
4.6.1 Implementation
-
- df_user = pd.read_csv('playlist.csv',encoding="unicode_escape",header=0,names=['url','title','play','user'],sep=',')
- df_user.shape
- df_user = df_user.iloc[:,1:]
- df_user['count'] = 0
- df_user = df_user.groupby('user',as_index=False)['count'].count()
- df_user = df_user.sort_values('count',ascending=False)[:10]
- df_user
- df_user = df_user[:10]
- names = df_user['user'].tolist()
- nums = df_user['count'].tolist()
- df_u = get_matplot(x=names,y=nums,chart='barh',title='歌单贡献UP主 TOP10',ha='left',size=10,color=color[4])
- df_u
4.6.2 Results
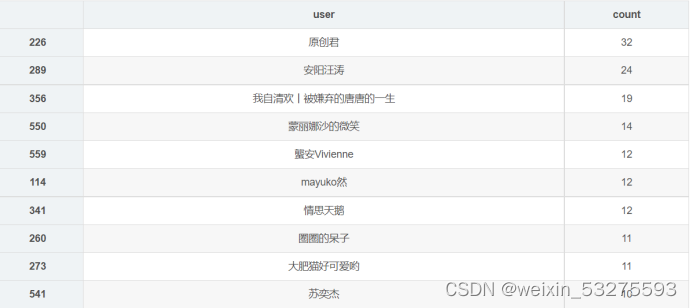
Figure 4-10 Song list contribution up top ten
4.6.3 Visualization
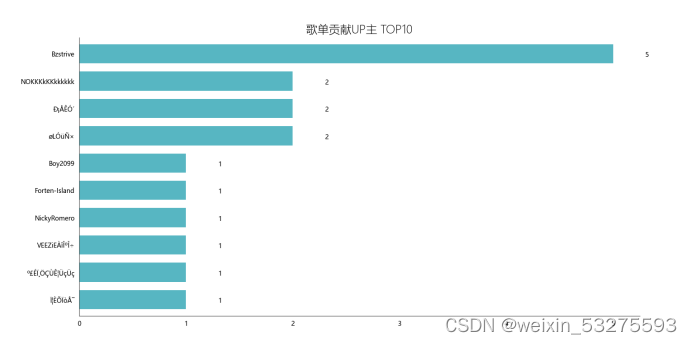
Figure 4-11 Top 10 contributors to the song list
4.7 Song list name generation word cloud
4.4.1 Implementation
- import wordcloud
- import pandas as pd
- import numpy as np
- from PIL import Image
- data = pd.read_excel('music_message.xlsx')
- #根据播放量排序,只取前五十个
- data = data.sort_values('play',ascending=False).head(50)
-
- #font_path指明用什么样的字体风格,这里用的是电脑上都有的微软雅黑
- w1 = wordcloud.WordCloud(width=1000,height=700,
- background_color='black',
- font_path='msyh.ttc')
- txt = "\n".join(i for i in data['title'])
- w1.generate(txt)
- w1.to_file('F:\\词云.png')
4.7.2 Results and visualization
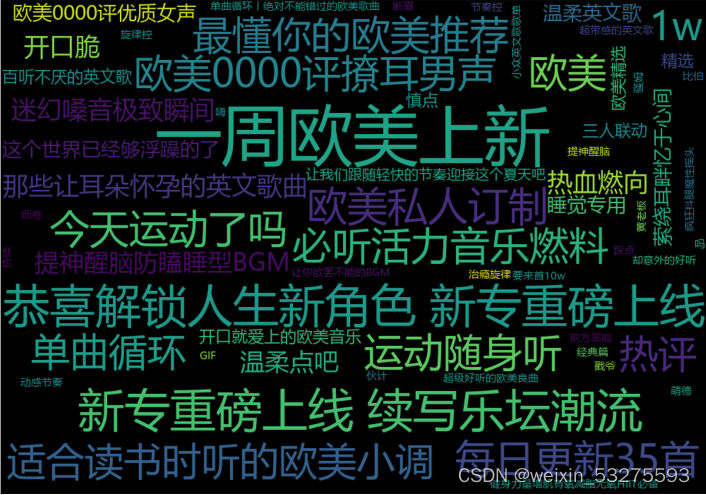
Figure 4-11 Word cloud generated by song list name
4.8 Code implementation
To simplify the code, a generic function is built
get_matplot(x,y,chart,title,ha,size,color)
x means to serve as the x-axis data;
y means to serve as the y-axis data;
chart represents the icon type, which is divided into three types: barh, hist, and squarify.plot;
ha indicates the relative orientation of the text;
size indicates the font size;
color indicates the color of the chart;
-
- def get_matplot(x,y,chart,title,ha,size,color):
- # 设置图片显示属性,字体及大小
- plt.rcParams['font.sans-serif'] = ['Microsoft YaHei']
- plt.rcParams['font.size'] = size
- plt.rcParams['axes.unicode_minus'] = False
- # 设置图片显示属性
- fig = plt.figure(figsize=(16, 8), dpi=80)
- ax = plt.subplot(1, 1, 1)
- ax.patch.set_color('white')
- # 设置坐标轴属性
- lines = plt.gca()
- # 设置显示数据
- if x ==0:
- pass
- else:
- x.reverse()
- y.reverse()
- data = pd.Series(y, index=x)
- # 设置坐标轴颜色
- lines.spines['right'].set_color('none')
- lines.spines['top'].set_color('none')
- lines.spines['left'].set_color((64/255, 64/255, 64/255))
- lines.spines['bottom'].set_color((64/255, 64/255, 64/255))
- # 设置坐标轴刻度
- lines.xaxis.set_ticks_position('none')
- lines.yaxis.set_ticks_position('none')
- if chart == 'barh':
- # 绘制柱状图,设置柱状图颜色
- data.plot.barh(ax=ax, width=0.7, alpha=0.7, color=color)
- # 添加标题,设置字体大小
- ax.set_title(f'{title}', fontsize=18, fontweight='light')
- # 添加歌曲出现次数文本
- for x, y in enumerate(data.values):
- plt.text(y+0.3, x-0.12, '%s' % y, ha=f'{ha}')
- elif chart == 'hist':
- # 绘制直方图,设置柱状图颜色
- ax.hist(y, bins=30, alpha=0.7, color=(21/255, 47/255, 71/255))
- # 添加标题,设置字体大小
- ax.set_title(f'{title}', fontsize=18, fontweight='light')
- elif chart == 'plot':
- colors = ['#adb0ff', '#ffb3ff', '#90d595', '#e48381', '#aafbff', '#f7bb5f', '#eafb50',
- '#adb0ff', '#ffb3ff', '#90d595', '#e48381', '#aafbff', '#f7bb5f', '#eafb50',
- '#adb0ff', '#ffb3ff', '#90d595', '#e48381', '#aafbff', '#f7bb5f', '#eafb50',
- '#adb0ff', '#ffb3ff', '#90d595', '#e48381', '#aafbff', '#f7bb5f', '#eafb50',
- '#adb0ff', '#ffb3ff', '#90d595', '#e48381', '#aafbff', '#f7bb5f', '#eafb50',
- '#adb0ff', '#ffb3ff', '#90d595', '#e48381', '#aafbff', '#f7bb5f', '#eafb50',
- '#adb0ff', '#ffb3ff', '#90d595', '#e48381', '#aafbff']
- plot = squarify.plot(sizes=y, label=x, color=colors, alpha=1, value=y, edgecolor='white', linewidth=1.5)
- # 设置标签大小为1
- plt.rc('font', size=6)
- # 设置标题大小
- plot.set_title(f'{title}', fontsize=13, fontweight='light')
- # 除坐标轴
- plt.axis('off')
- # 除上边框和右边框刻度
- plt.tick_params(top=False, right=False)
- # 显示图片
- plt.show()
- #构建color序列
- color = [(153/255, 0/255, 102/255),(8/255, 88/255, 121/255),(160/255, 102/255, 50/255),(136/255, 43/255, 48/255),(16/255, 152/255, 168/255),(153/255, 0/255, 102/255)]
In the process of completing the big homework, I learned a lot of new things, and connected the knowledge I learned in class this semester. When encountering some blurred memory problems, I can perfectly solve them by looking through textbooks and previous live broadcast playbacks and deepen my impression of such problems. Next time I encounter the same problem, I can also give solutions; For problems that have not been covered, I actively search for information on the Internet, and practice the solutions I find until I can actually solve the problem. I know that everyone will encounter various problems in the actual operation process, and there are also areas that they do not understand, and with the development of the network, various things are constantly being updated. What I have obtained Knowledge also needs to be updated, so it is our compulsory course to accurately find information on the Internet and quickly find solutions.
During the completion of this assignment, I also encountered many problems, such as errors in data crawling, visualization failures, and incomprehensible codes. After encountering a problem, I will first check my code by myself, and modify it in time if I find an error. If I encounter a problem that cannot be solved, I will search the error message of the program to find a solution to this error. Fortunately, all the problems I encountered during the completion of this assignment have been resolved.
In the process of completing this homework, bittersweet mixed. In the continuous learning process, there is not only the nervousness of encountering problems that cannot be solved, but also the sense of accomplishment of successfully solving problems. I also learned a lot of knowledge and acquired certain skills accordingly. Thanks to the teachers and classmates for their help, I will be more serious in the future, try to improve my ability, and work harder to learn python and data analysis technology.
Category of website: technical article > Blog
Author:Believesinkinto
link:http://www.pythonblackhole.com/blog/article/25322/d0fa5c6ca801a9ef275a/
source:python black hole net
Please indicate the source for any form of reprinting. If any infringement is discovered, it will be held legally responsible.
name:
Comment content: (supports up to 255 characters)
no articles