python数据分析-matplotlib散点图-条形图的绘制以及完整方法归纳02
posted on 2023-05-03 19:58 read(1012) comment(0) like(9) collect(5)
Basic use of matplotlib 02
1. Drawing of scatter plot
The scatter diagram is drawn using the scatter() method, and the parameters passed in are also two lists, which are the values of the x and y coordinate axes. Using a scatter diagram can show whether there is a correlation between the values in several sequence sequences.
2. Scatter plot drawing steps and case analysis
1. Import module
from matplotlib import pyplot as plt
import matplotlib
2. Set the font style of all characters in the scatter plot
matplotlib.rcParams['font.family'] = 'Microsoft Yahei' # font style
3. Write the main code
from matplotlib import pyplot as plt
import matplotlib

matplotlib.rcParams['font.family'] = 'Microsoft Yahei'  # 字体样式


def draw():
    x = [30.1, 29.9, 29.9, 28.1, 28.1, 27.7, 27.6, 27.0, 26.5, 26.4, 26.0,
         25.5, 24.6, 24.5, 24.4, 23.4, 23.2, 22.4,
         21.6,
         21.3, 21.2, 21.0, 20.6, 20.4, 20.3, 20.3, 20.1, 20.1, 20.0, 19.4,
         18.6, 18.2, 18.2, 18.2, 18.1, 18.1, 18.1,
         18.1,
         18.0, 17.9, 17.6, 17.4, 17.3, 17.3, 17.2, 17.1, 17.1, 16.9, 16.7,
         16.7]

    y = [52.3, 55.2, 48.9, 45.9, 45.7, 50.3, 49.3, 45.1, 58.0, 46.1, 45.3,
         43.7, 47.9, 45.3, 52.9, 46.8, 47.3, 49.3,
         46.5,
         47.6, 46.3, 43.6, 44.3, 44.6, 49.0, 40.8, 41.1, 41.2, 42.5, 44.1,
         50.5, 46.0, 45.2, 44.0, 54.2, 48.0, 41.0,
         45.8,
         40.8, 50.1, 48.3, 41.5, 44.3, 47.9, 63.8, 46.3, 45.2, 39.2, 46.8,
         39.3]
    z = ['勒布朗-詹姆斯', '扬尼斯-阿德托昆博', '乔尔-恩比德', '特雷-杨', '卢卡-东契奇', '德马尔 - 德罗赞',
         '贾 - 莫兰特', '杰森 - 塔特姆', '尼古拉 - 约基奇', '德文 - 布克', '多诺万-米切尔',
         '斯蒂芬-库里', '扎克-拉文', '谢伊-吉尔杰斯-亚历山大', '卡尔-安东尼-唐斯',
         '杰伦-布朗', '达龙-福克斯', '帕斯卡尔-西亚卡姆', '达里厄斯-加兰', '吉米-巴特勒', '德章泰-默里',
         '安东尼-爱德华兹', '泰勒-希罗', '克里斯-米德尔顿', '迈尔斯-布里奇斯', '弗雷德 - 范弗利特',
         '朱利叶斯 - 兰德尔', 'RJ - 巴雷特', '拉梅洛 - 鲍尔', '特里 - 罗齐尔', '朱 - 霍勒迪',
         '德斯蒙德-贝恩', '乔丹-普尔', '拉塞尔-威斯布鲁克', '约纳斯-瓦兰丘纳斯', '尼古拉 - 武切维奇',
         '小加里 - 特伦特', '博扬 - 波格丹诺维奇', '丹吉洛 - 拉塞尔', '克里斯蒂安 - 伍德',
         '托拜厄斯-哈里斯', '凯德-坎宁安', '安芬尼-西蒙斯', '泰雷斯-马克西', '德安德烈 - 艾顿',
         '安德鲁 - 威金斯', '凯尔 - 库兹马', '雷吉 - 杰克逊', '哈里森 - 巴恩斯', '科尔 - 安东尼']
    # 绘制图像
    plt.figure(figsize=(16, 8), dpi=80)
    # 将数据绘制到散点图上
    plt.scatter(x, y)
    plt.title('NBA2021-2022赛季球员得分榜前50名命名率散点图', color='red',fontsize=23)  # 添加标题
    plt.xlabel('分数', color='green', fontsize=16)  # 添加x轴文字
    plt.ylabel('命名率: %', color='green', fontsize=16)  # 添加y轴文字

    x_ticks = x[::-1]  # 得到升序的分数
    # 添加x轴的刻度内容
    plt.xticks(x_ticks[::5] + [max(x)], rotation=45)  # 按照步长为5拿内容, 再将最后的一个数字放进去

    y_ticks = range(int(min(y)), int(max(y)) + 1)  # 得到命中率的升序
    # 添加xy轴的刻度内容
    plt.yticks(y_ticks[::4])  # 将y轴的刻度内容展现出来
    # 将姓名放到图当中付出
    n = 0
    for i, j in zip(x, y):  # 迭代两个列表
        # x轴坐标 y轴坐标 姓名 字体大小
        plt.text(i - 0.5, j + 0.4, z[n], fontsize='10')
        n += 1
    # 将图展示出来
    plt.show()


draw()
4. Theme code analysis
for i, j in zip(x, y): # 迭代两个列表
# x轴坐标 y轴坐标 姓名 字体大小
plt.text(i - 0.5, j + 0.4, z[n], fontsize=‘10’)
n += 1
这段代码主要是给每一个点都写上它的标识,这里的zip是matplotlib的一种迭代方法,它可以配合for循环迭代,将两个列表的对应元素打包成一个个的元组,然后返回有这些元组组成的列表
[(),(),(),(),(),(),(),()],里面使用text方法把各个元组对应的点的标识添加上去,上面-0.5和+0.4是因为有些元组对应坐标点在我们绘制图的范围外.
5.图形展示

三.条形图的绘制
使用bar方法,条形图用来比较各独立类别下的某单独数据的大小
plt.bar(x, height, width)
x: 数据的个数, 可以数字, 也可以是range对象
height: 要绘制的数据
width: 表示柱状的宽度, 默认为0.8
四.条形图案例展示
例: 勒布朗.詹姆斯职业生涯常规赛平均数据条形图
1.导入模块
from matplotlib import pyplot as plt
import matplotlib
五.绘制条形图完整代码
def main():
    # 每赛季的平均得分
    height = [20.9, 27.2, 31.4, 27.3, 30.0, 28.4, 29.7, 26.7, 27.1,
              26.8, 27.1, 25.3, 25.3, 26.4, 27.5, 27.4, 25.3, 25.0,
              30.1]
    # 生涯平均得分
    avg = sum(height) / len(height)
    # 绘制图像
    plt.figure(figsize=(16, 9), dpi=80)
    # 将数据绘制到柱状图上
    plt.bar(range(len(height)), height, width=0.4)
    # 将生涯平均得分画一条折线图
    plt.plot(range(len(height)), [avg for i in range(len(height))],
             color='red')
    # 添加标题
    plt.title('勒布朗.詹姆斯职业生涯常规赛平均数据条形图', color='red',
              fontsize=23)
    # 添加x轴文字
    plt.xlabel('赛季', color='green', fontsize=16)
    # 添加y轴文字
    plt.ylabel('分数', color='green', fontsize=16)
    # 生成x轴内容的列表
    x_ticks = ['%d-%d赛季' % (i, i + 1) for i in range(2003, 2022)]
    # 添加x轴的刻度内容
    plt.xticks(range(len(height)), x_ticks, rotation=30)
    # 得到一个range对象, 起始值是分数最小值, 结束值是分数是大值, 同时得把最大值包含进去
    y_ = range(int(min(height)), int(max(height)) + 2)  # 得到命中率的升序
    y_ticks = ['%d分' % i for i in y_]  # 生成分数的列表内容
    plt.yticks(y_[::2], y_ticks[::2])  # 将y轴的刻度内容展现出来
    # 展示风格
    plt.grid(alpha=0.3)
    # 将图展示出来
    plt.show()


main()
grid是设置背景网格的透明度(0-1)
六.条形图展示

七.多个条形图展示
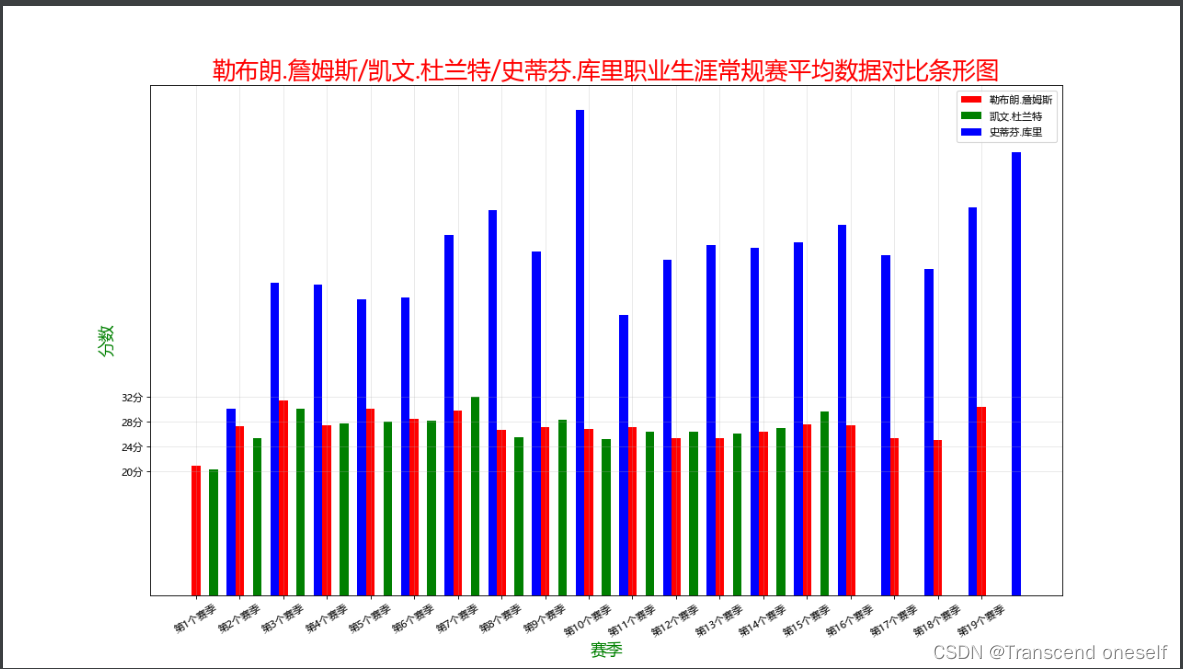
例: 勒布朗.詹姆斯/凯文.杜兰特职业生涯常规赛平均数据对比条形图
from matplotlib import pyplot as plt
import matplotlib  # 载入matplotlib完整库

matplotlib.rcParams['font.family'] = 'Microsoft Yahei'  # 字体,改为微软雅黑,默认 sans-serif


def main():
    # 詹姆斯
    height1 = [20.9, 27.2, 31.4, 27.3, 30.0, 28.4, 29.7, 26.7, 27.1, 26.8,
               27.1, 25.3, 25.3, 26.4, 27.5, 27.4, 25.3, 25.0, 30.3]
    # 杜兰特
    height2 = [20.3, 25.3, 30.1, 27.7, 28.0, 28.1, 32.0, 25.4, 28.2, 25.1,
               26.4, 26.4, 26.0, 26.9, 29.6]
    # 库里
    height3 = [30, 50.3, 50.1, 47.7, 48.0, 58.1, 62.0, 55.4, 78.2, 45.1,
               54, 56.4, 56.0, 56.9, 59.6, 54.8, 52.6, 62.5, 71.3]

    # 绘制图像
    plt.figure(figsize=(16, 9), dpi=80)
    # 将数据绘制到柱状图上
    # 从x轴不断往右来添加数据, 同时在原有位置上往右挪0.4
    plt.bar([i for i in range(len(height1))], height1, width=0.2,
            color='red', label='勒布朗.詹姆斯')
    plt.bar([i+0.2 for i in range(len(height2))], height2, width=0.2,
            color='green', label='凯文.杜兰特')
    plt.bar([i + 0.4 for i in range(len(height3))], height3, width=0.2,
            color='blue', label='史蒂芬.库里')
    # 添加标题
    plt.title('勒布朗.詹姆斯/凯文.杜兰特/史蒂芬.库里职业生涯常规赛平均数据对比条形图',
              color='red', fontsize=23)
    # 添加x轴文字
    plt.xlabel('赛季', color='green', fontsize=16)
    # 添加y轴文字
    plt.ylabel('分数', color='green', fontsize=16)
    # 生成x轴内容的列表
    x_ticks = ['第%d个赛季' % (i + 1) for i in range(len(height1))]
    # 添加x轴的刻度内容
    plt.xticks(range(len(height1)), x_ticks, rotation=30)
    # 得到一个range对象, 起始值是分数最小值, 结束值是分数是大值, 同时得把最大值包含进去
    y_ = range(int(min(height1)), int(max(height1)) + 2)  # 得到命中率的升序
    y_ticks = ['%d分' % i for i in y_]  # 生成分数的列表内容
    plt.yticks(y_[::4], y_ticks[::4])  # 将y轴的刻度内容展现出来
    # 展示风格
    plt.grid(alpha=0.3)
    # 展示图例
    plt.legend()
    # 将图展示出来
    plt.show()


main()
1. Result display

Eight. Summary
This article is mainly to familiarize yourself with the example methods in the matplotlib library through the form of a case. Furthermore, the bar chart scatter chart and the line chart in the previous article, in fact, their main steps are the same, we only need to remember and be familiar with them They are different, to achieve twice the result with half the effort, I hope this article can bring you help, thank you for your support!
Category of website: technical article > Blog
Author:Abstract
link:http://www.pythonblackhole.com/blog/article/251/20dbde8777636b7695aa/
source:python black hole net
Please indicate the source for any form of reprinting. If any infringement is discovered, it will be held legally responsible.
name:
Comment content: (supports up to 255 characters)
no articles
